Insights and visual management
Bulk's reporting and visual-management tools: KPIs, dashboards, analytics, teamboards, boards, whiteboards, Atlas, and the Digital Twin, with a guide each.
Last updated
Insights and visual management is the family of Bulk tools for seeing how your operation is performing, tracking it against targets, and putting the numbers where your teams can act on them. It brings together the measures you define, the live boards you watch, the analytical reports you dig into, and the shared surfaces your teams gather around each day.
Bulk is a manufacturing execution system (MES) — the software that runs and records what happens on the shop floor. Every tool in this section reads from that same shop-floor data, so the numbers you plan against, display on the wall, and review across sites all come from one source rather than from separate spreadsheets.
This page is a map. It explains what each tool is for and links to the step-by-step guide for each. If you are new to this area, skim the whole page first, then open the guide that matches what you need to do.
Throughout Bulk, an entity means one site — a single physical plant or location. Almost everything here is scoped to the entity you have selected, so the boards and reports you see always belong to a specific site.
What is in this section
The tools group into four jobs: defining what you measure, watching live performance, running team routines, and looking across plants.
Define what you measure
- KPIs — A KPI (key performance indicator) is a single named measure of how a part of your operation is doing, such as on-time delivery, scrap rate, or safety incidents. You define each KPI, give it a target, and record actual values so Bulk can show whether it is on or off track. See KPIs.
Watch live performance
- Dashboards — Bulk's built-in dashboards for one site: operator and machine effectiveness, station status, flow, quality, and downtime. Choose one from the full-screen gallery, then open its current report on a wall display. The gallery cards are illustrative previews. See Dashboards.
- Analytics — The individual analytical reports you open one at a time to dig into a question: OEE Timeline for assets and people, the Asset Board, Assets Sheet, Asset Revenue, and the 5S Dashboard. OEE (Overall Equipment Effectiveness) is a standard measure of how much good output a machine or operator produces versus its theoretical best. See Analytics.
- Digital Twin — A 3D model of your factory floor that shows live machine status, OEE, and job progress in the layout of the real plant. This area is in beta. See Digital Twin.
Run team routines and share
- Teamboards — Shared boards your teams gather around for a daily stand-up, showing KPI status for a site. Teamboards are also where you record the day's actual KPI values through a New report. See Teamboards.
- Boards — Build your own board for a site by placing individual widgets on a canvas, for when the built-in dashboards do not show exactly what you want. See Boards.
- Whiteboard — A free-form space for brainstorming, sketching a problem, or mapping ideas with your team, separate from the data-backed boards. See Whiteboard.
See across plants
- Atlas — A cross-plant executive view that rolls performance up across several sites into one comparison, so leaders can see the whole organisation at a glance instead of one plant at a time. This area is in beta. See Atlas.
Where to find these in Bulk
There is no single menu named "Insights and visual management" inside the app — that is how this documentation groups the tools. In Bulk you reach them in a few places:
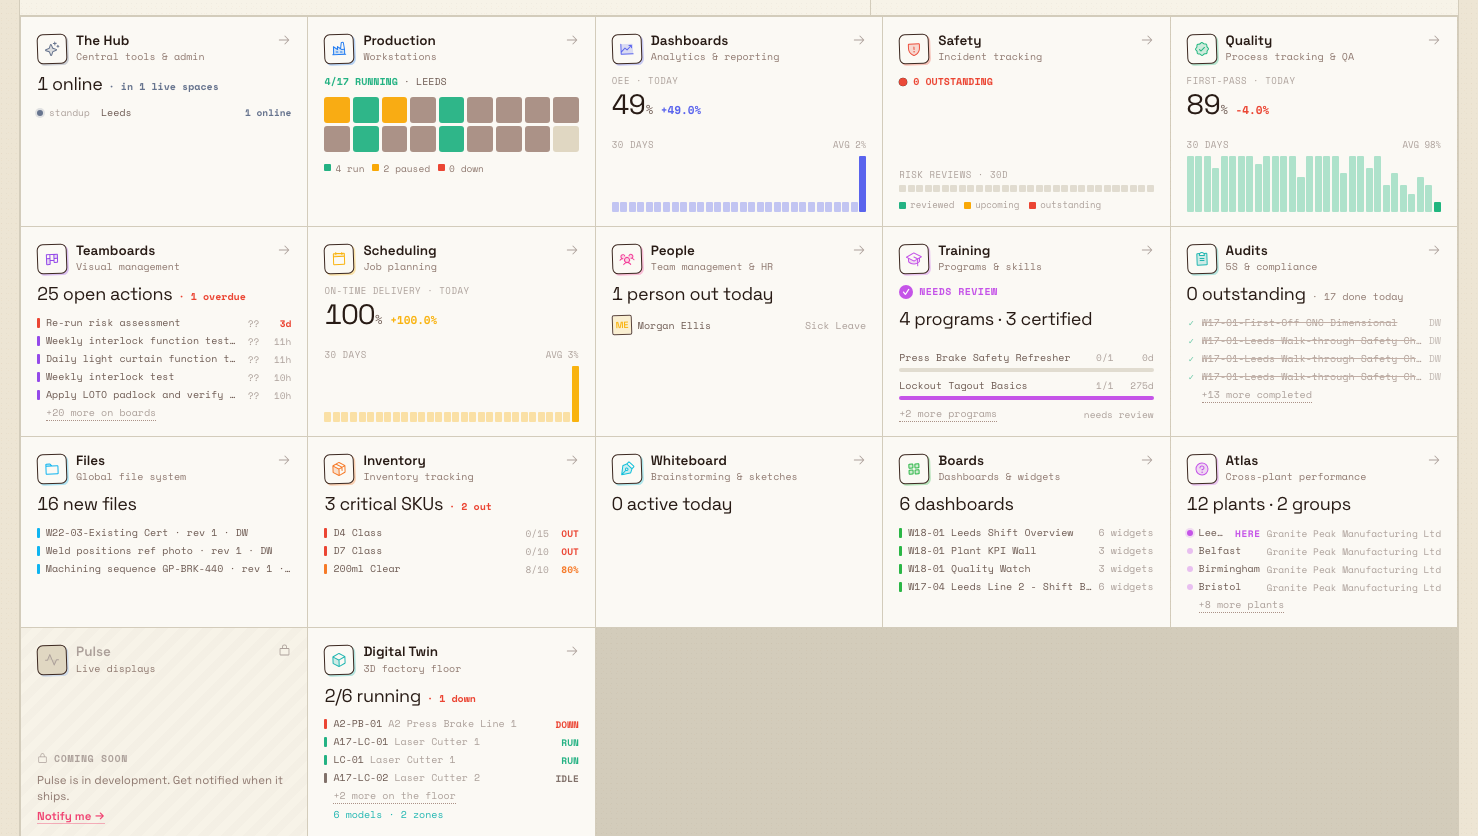
- Home screen, Your apps. Most areas open as a tile in the Home app grid: Dashboards, Teamboards, Boards, Atlas, Digital Twin, and Whiteboard. Select a tile to open that app. Browse apps opens the app catalogue. The grid lists apps installed in your workspace.
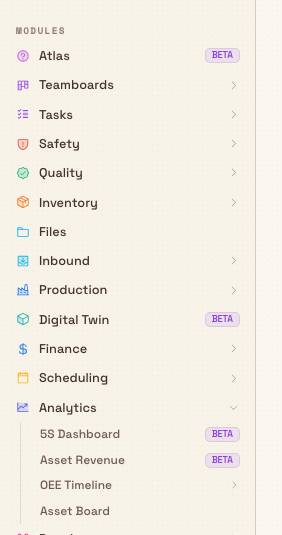
- Left sidebar, under Modules. Related tools appear in the left navigation sidebar under the Modules heading. Analytics lives here as its own group — expand it to reach OEE Timeline, Asset Board, Assets Sheet, Asset Revenue, and the 5S Dashboard. Analytics reports are opened from the sidebar rather than from a Home tile.
- Settings, for KPI setup. Defining KPIs, their categories, and their targets happens under Settings → KPI. Recording daily KPI values happens under Teamboards → New report.
Before you start
To use anything in this section you need to be signed in and have a site (entity) selected. Bulk uses your selected site to filter the boards, reports, and KPIs you work with.
Beyond that, each area is controlled by its own permission, so what you can see and do depends on your role:
- Viewing these tools is granted by permissions such as View OEE analytics, View KPIs, View teamboards, View boards, View Atlas, and View digital twin.
- Setting things up — creating KPIs, editing dashboards, managing teamboards or boards, or editing the Digital Twin layout — needs the matching manage or edit permission, which is usually reserved for administrators and managers.
There is a read-only Dashboards role that bundles view access to all of these areas — analytics, KPIs, teamboards, boards, Atlas, and the Digital Twin — without any setup rights. It is a good fit for someone who needs to watch the numbers but should not change them, such as a team on a shop-floor display.
Do not see a tool that is described here?
If a module, menu item, or report described on this page is missing for you, check whether the app is installed, whether your role includes its permission, and whether the correct site is selected. Ask an administrator to adjust your role, or switch to the correct site first. Each linked guide lists the exact permission it needs.
Choose the right tool
Use this table to jump to the area that matches what you are trying to do.
| If you want to… | Use | Guide |
|---|---|---|
| Define and target the numbers a site tracks | KPIs | KPIs |
| Put a ready-made report on a wall display | Dashboards | Dashboards |
| Dig into OEE, revenue, or 5S for assets and people | Analytics | Analytics |
| Run a daily stand-up around shared KPI status | Teamboards | Teamboards |
| Build a custom board from individual widgets | Boards | Boards |
| Sketch ideas or map a problem freely | Whiteboard | Whiteboard |
| See a 3D live view of the factory floor | Digital Twin | Digital Twin |
| Compare performance across several plants | Atlas | Atlas |
Example: Wayne Enterprises
Wayne Enterprises runs several sites, including Gotham Applied Sciences. Here is how the different tools fit together over a normal week.
- Set up the measures once. Bruce, the plant administrator, defines the KPIs the Gotham site tracks — recordable incidents, first-pass yield, on-time delivery — and sets a daily target for each in Settings → KPI.
- Record the numbers each day. Every morning the shift lead opens Teamboards → New report, picks Gotham Applied Sciences and yesterday's date, and enters the actual values. Bulk compares each one against its target automatically.
- Run the stand-up. The team gathers around a Teamboard that shows which measures met target and which slipped, so the conversation starts from the numbers rather than from memory.
- Watch the floor live. A Dashboard — OEE / Assets — runs on a wall display by the line all shift, and the line supervisor opens the Analytics OEE Timeline when they need to see exactly when a machine went down.
- Look across the group. At the end of the week, the operations director opens Atlas to compare Gotham against the other sites in one view, and flags the site that is falling behind on delivery.
No one calculates any of these numbers by hand. Each tool reads the same shop-floor data, so the daily report, the wall display, and the cross-plant comparison all agree.
What to expect
Once your KPIs are defined and your teams are recording values, the boards and reports keep themselves current from the underlying data. The measures you plan against appear on teamboards and dashboards, the analytical reports let you drill into any one of them, and — where it is available — Atlas rolls the picture up across sites. Every value stays tied to the site it belongs to.
Feature availability
Most of this section is generally available: KPIs, Dashboards, Analytics, Teamboards, Boards, and Whiteboard. A few areas are still maturing, and Bulk marks them so you know:
- Within Analytics, the 5S Dashboard and Asset Revenue reports carry a Beta label in the menu. They work, but expect them to keep changing.
- Atlas and the Digital Twin show Beta badges in the current sidebar and are documented as beta areas. Treat them as capable but still evolving rather than final, and check their guides for the current state before relying on them for reporting.
Beta means the feature is usable but not yet finished, so its behaviour and appearance may change between releases. Do not assume a beta area is complete or that everything described in its guide is final.
Troubleshooting
- A tool or menu described here is not visible. Home lists installed apps, and access is controlled by your role's permissions. Check Browse apps with an administrator if an app is missing. For a report or action, ask an administrator to grant the matching permission, or to add you to a role — such as the read-only Dashboards role — that already has it.
- The numbers look wrong or a board is empty. Check which site is selected at the top of the app. Boards, reports, and KPIs scope to one entity at a time, so an unexpected result is often another site's data — or a site with nothing recorded yet. Switch to the correct site and look again.
- A KPI is missing when you plan targets or enter a report. A KPI only appears for the sites it is scoped to. Confirm the KPI is scoped to the current site and that you have that site selected.
Related guides
- KPIs — define, target, and record the measures a site tracks.
- Dashboards — open Bulk's built-in dashboards.
- Analytics — OEE Timeline, Asset Board, Asset Revenue, and 5S reports.
- Teamboards — shared KPI boards and daily reports.
- Boards — compose a custom board from widgets.
- Whiteboard — free-form brainstorming and sketches.
- Atlas — cross-plant executive performance (beta).
- Digital Twin — a 3D live view of the factory floor (beta).