Beta
Atlas
Atlas is Bulk's cross-plant executive dashboard: build saved views that compare every site side by side across the metrics and KPIs that matter, then share them with your team.
Atlas is Bulk's cross-plant executive dashboard. Its tagline inside the product sums it up: "Every site, side by side." Atlas arranges your plants (each production site is an "entity" in Bulk) down the rows of a grid and the metrics you pick across the columns, so you can read performance across your whole organization at a glance instead of opening one site at a time. Shared shell pieces such as the plant switcher and page tabs stay consistent with the rest of Bulk so you can jump from Atlas into Settings or another module without relearning the chrome.
You reach Atlas from the left navigation under the "Modules" heading — the entry is labelled "Atlas" and carries a "Beta" badge — or from the "Atlas" tile on your home dashboard. Both open the same full-width board at the /atlas address. Once you are inside any other area of Bulk, the left navigation stays with you, so you can return to Atlas without going back through Home.
This page is the starting point for the Atlas module: what it is, who can use it, how the board is laid out, and what you can do there. For a step-by-step walkthrough of building and reading a comparison, follow the task guide linked under "Related guidance" rather than repeating the steps here.
When to use Atlas
Reach for Atlas when the question spans more than one site:
- Compare the same measure — production output, equipment effectiveness, open safety incidents, training compliance — across every plant in one grid.
- Run a weekly or monthly executive scorecard where each site is a row and each column is a target-tracked number.
- Spot which site is lagging on a metric, then open that cell to see the detail behind it.
- Leave a short, shared note on a cell so the next person reading the board sees your context.
If you only ever look at one plant, the single-site dashboards and analytics screens are usually a better fit. Atlas earns its place once you have several sites to weigh against each other.
Before you start
A few things need to be true before Atlas is useful to you:
- Permission to open Atlas. You need the "View Atlas" permission (
atlas.view). By default it is granted to the "Entity admin", "Manager", and "Dashboards" roles. With it you can open Atlas, use views shared with you, build and manage your own views, and request access to restricted ones. - Permission to manage shared views and targets. Renaming, sharing, or deleting a view that belongs to someone else, resolving access requests, and setting monthly targets all require the "Manage Atlas views" permission (
atlas.manage). By default only the "Entity admin" role has it. View owners can always edit and share their own views without it. - More than one plant. Atlas compares sites, so it comes into its own once your organization has several plants set up. With a single plant the home tile prompts you to "Add plants to compare across sites."
Atlas is in beta
Atlas is a newer Bulk module and is still evolving — the "Beta" badge next to it in the navigation signals that. The building blocks described here are in place today, but labels, defaults, and behaviour may change as the module matures. Treat this page as a current-state reference, not a promise of a fixed feature set.
How the board is laid out
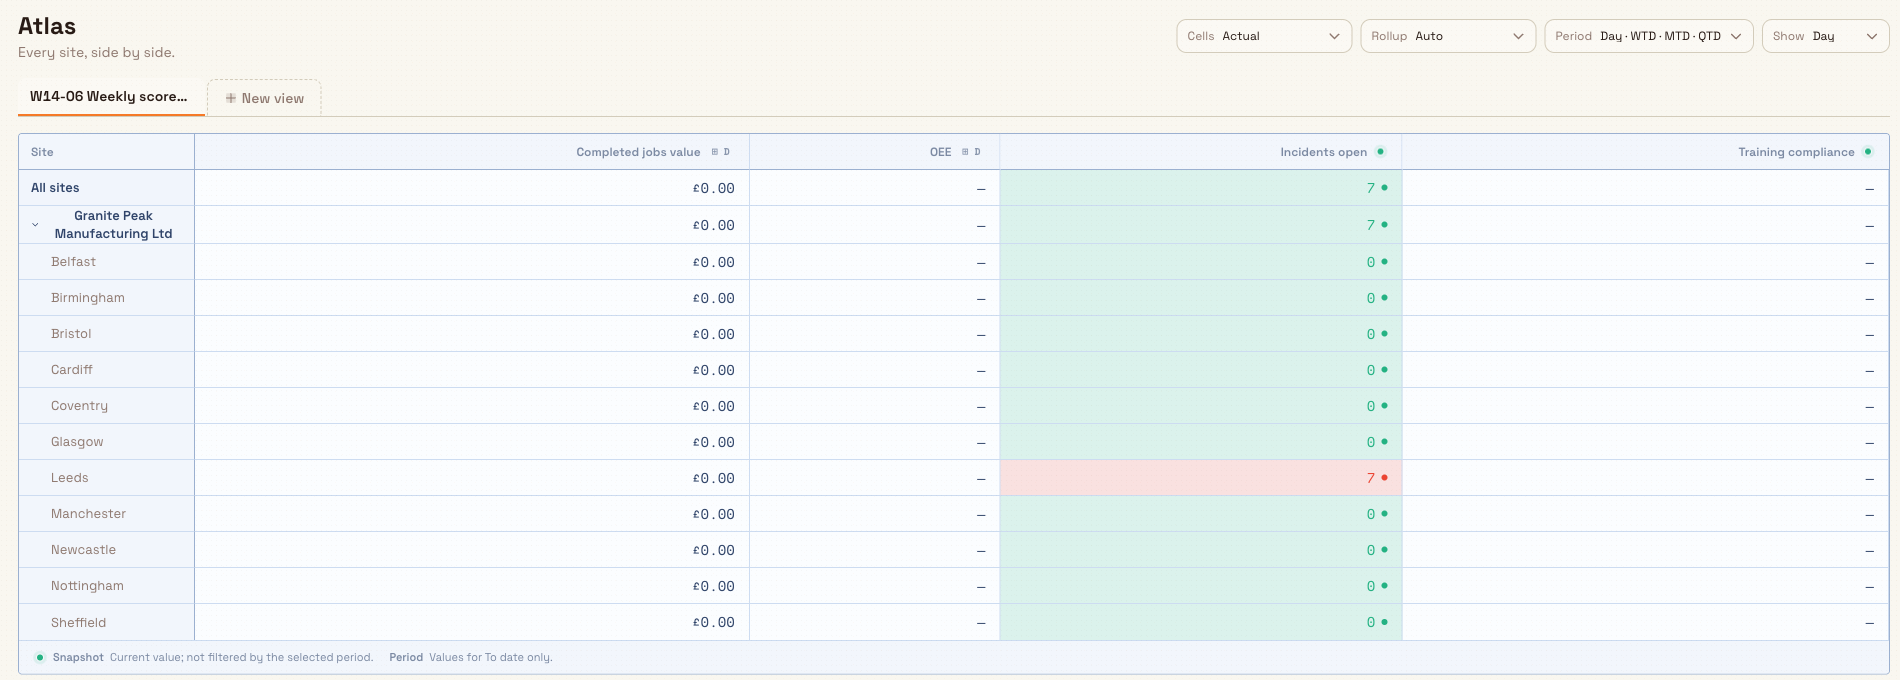
Atlas is a pivot table — a grid where the rows and columns each stand for something and every cell is the number where they meet:
- Rows are your sites. Each plant you can access is a row. Plants that belong to the same legal entity are gathered under a group subtotal row, and a single all-sites total row rolls everything up. So a three-plant, two-group organization reads as individual plants, group subtotals, and one grand total.
- Columns are metrics. Every column is a metric or KPI you have added to the view — one number per site.
- Views are saved tabs. A "view" is a saved arrangement of sites, metrics, and display settings. Views appear as tabs across the top; you can keep several and switch between them.
- The Cells picker reformats the whole sheet. Choose whether cells show the actual, plan and difference, or only the difference to target. Period expansion is controlled separately on each metric.
Know how fresh the sheet is
A saved Atlas view with at least one metric refreshes its pivot values every 15 minutes. Atlas keeps the last successful values visible while the next refresh runs or if an update fails, so the sheet does not disappear while new values are prepared. The freshness line tells you what is happening:
- Data from 7m ago identifies the latest successful saved values and shows their age.
- Updating · data from 14m ago means new values are being prepared while the previous values remain visible.
- Update delayed · data from 32m ago means Atlas could not update on schedule and is still showing the last successful values.
- Preparing snapshot · Live preview means the saved result is not ready yet, so Atlas is temporarily calculating the view live.
The age updates on screen each minute. If an update is delayed or unavailable, select Retry to ask Atlas to try again; repeated selections are limited while a request is already queued. Unsaved layout or filter edits also use Live preview until you save them. Cell drilldowns continue to load on demand, so they are not limited to the saved pivot values.
atlas.overview-01
What you can do in Atlas
Build and save views
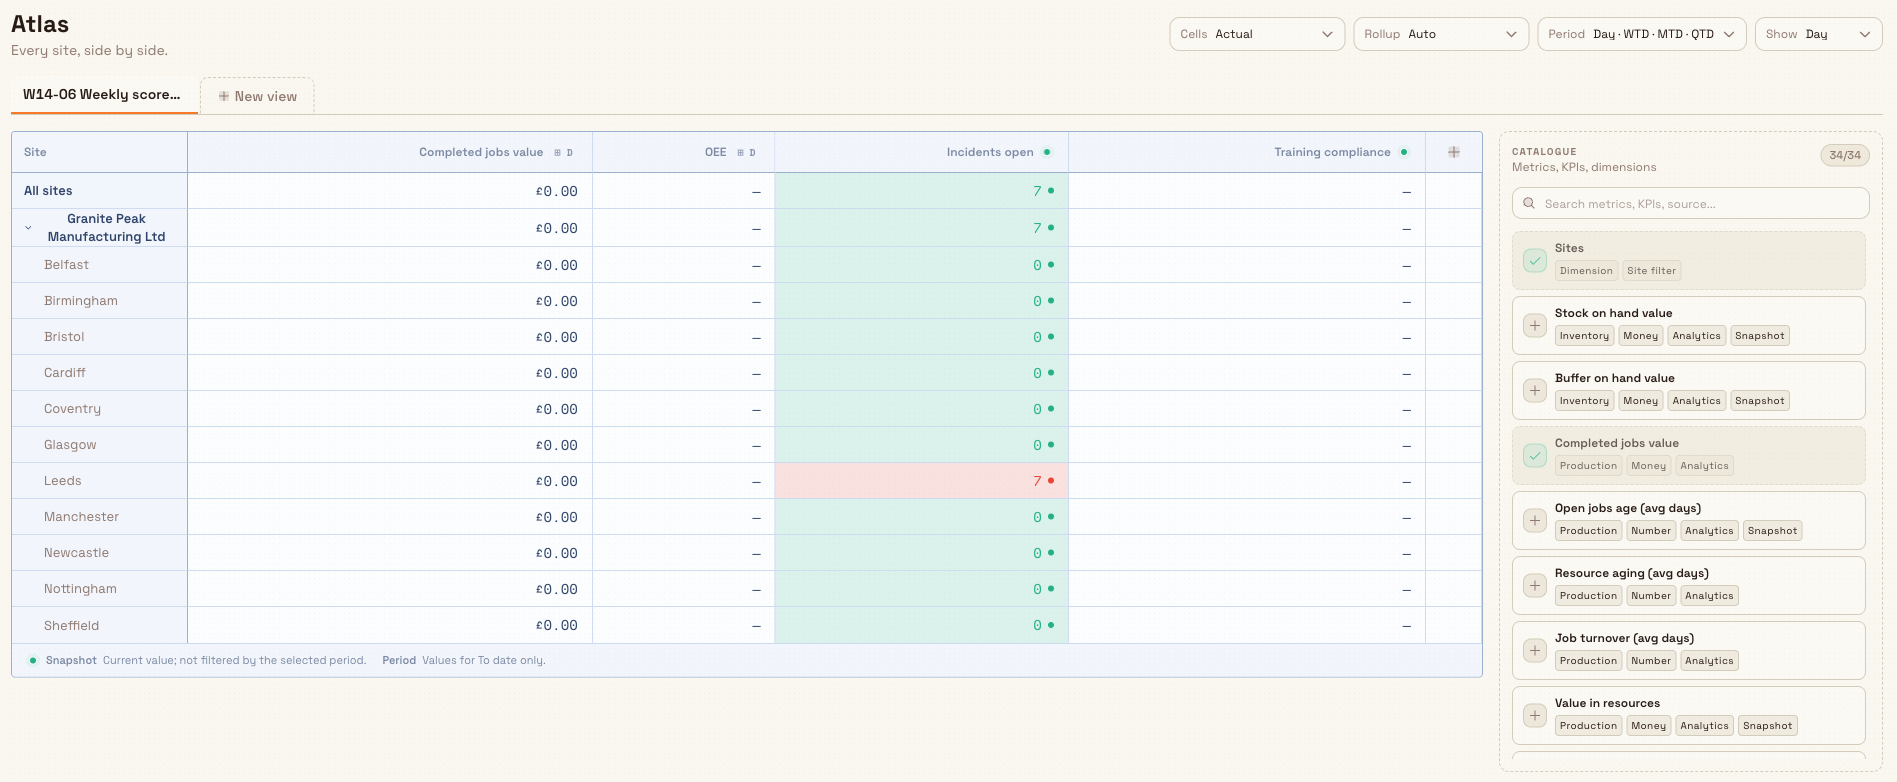
Turn on layout editing to open the "Fields" rail — a catalogue described in the app as "Metrics, KPIs, dimensions." It has a "Sites" section and a "Metrics" section. Drag a site or a metric onto the board to add it. As soon as you change the layout the view is marked as having unsaved edits; use "Save view" to keep the changes or "Discard" to drop them. You can also fork or duplicate a view to branch from an existing one, rename it, and set one view as your default tab.
atlas.overview-02
Reformat and expand metrics
The Cells picker restyles the whole sheet: choose "Actual" (one number with a status dot), "Plan · Act · Δ" (plan above, the gap below), or "Δ to target" (the signed gap only).
Every metric starts as one Day column. Select + Day beside a metric name to expand that metric into Day, WTD, MTD, and QTD. Select the minus control to collapse it again. Metrics expand independently, so you can keep a high-level board narrow and open only the periods you need. Expansion is temporary and is not saved to the view.
Atlas chooses the correct rollup for each metric. Totals are summed, rates and averages use their underlying weights, and OEE is recalculated from the combined recorded time rather than averaged from site percentages.
Understand the closed periods
Atlas uses completed local calendar days in each site's configured timezone, including absence and availability drilldowns. The organization-wide week-start rule determines every week-to-date boundary and week number, even when sites use different timezones. Today's partial activity is never included:
- Day is the complete previous local day.
- WTD starts on the organization's configured first day of the week and ends at yesterday's local close.
- MTD starts on the first day of this month and ends at yesterday's local close.
- QTD starts on the first day of this calendar quarter and ends at yesterday's local close.
Flow metrics, such as completed job value, add activity during the period. State metrics reconstruct the value at each completed day-end: Day shows yesterday's close, while WTD, MTD, and QTD average all completed daily closes. Empty completed days count as zero where the state is known. If Bulk does not have reliable history for a boundary, the cell shows #N/A rather than guessing.
On the first day of a week, month, or quarter, the matching to-date column shows 0 because no local calendar day in that period has finished yet. #N/A is reserved for missing or unreliable historical data.
Choose the right metrics
The metric catalogue holds built-in measures grouped by area — "Inventory", "Production", "Safety", "Training", "Tasks", "People", "Audits", "Quality", and "OEE" — with measures such as "Completed jobs value", "OEE", "Stock on hand value", "Incidents open", "Audits overdue", "Training compliance", and "Active headcount". You can also add any KPI your organization has defined so custom measures sit next to the built-ins.
Buffer on hand value adds the payable value of jobs that were Open or In Progress at each day-end. Each job includes its base price and its allocated share of assigned order services; a service is divided across its assigned jobs and counted once overall. Jobs stop contributing after they are completed, cancelled, or deleted. Buffer is not filtered by production resources. Use Value in resources when you need job value filtered to selected resources.
Open jobs age (avg days) shows how long the jobs that were Open or In Progress at each day-end had been open, on average, counted from each job's received date, or its creation date when no received date is recorded. It uses the same day-end reconstruction as Buffer, so both metrics load reliably even on views that compare several sites at once. Its resource filter follows each job's current resource step.
Buffer and Open jobs age rebuild each day-end from the recorded job status
history. Bulk records the current status and its matching history together for
manual, inbound, workflow-driven, and cascaded changes. When an older job's
history is incomplete or contradicts its current record, Atlas automatically
fills the affected day-ends from Bulk's captured document history instead, so
a few damaged records no longer blank out a whole site or multi-site total. A
cell only shows #N/A when neither source can vouch for a boundary — for
example, when a damaged stretch predates document capture.
Set targets and read the shading
When monthly targets are set for a metric, Atlas shades each cell by how it compares to its target — green for good, amber for the middle, red for bad — with a matching status dot. Targets are set per site, one month at a time, from the "Set targets…" action on a built-in metric. Because setting targets writes shared data, it requires the "Manage Atlas views" permission; without targets a cell simply shows its number and no shading.
Drill into a cell
Selecting a cell opens a drilldown panel beside the grid with the detail behind that number, and a place to leave a short weekly note tied to that exact site, metric, and period. Notes are shared, so a colleague opening the same cell later sees what you wrote.
Share a view
Each view has a sharing setting: "Private" (only you can see it), "Everyone" (everyone with Atlas access can view it), or "Restricted" (you plus the specific roles and people you choose; the tab stays visible to others but locked). This lets you keep a work-in-progress view to yourself and publish the finished scorecard to the people who need it.
A Granite Peak Manufacturing example
Granite Peak Manufacturing runs several plants, including the Leeds Fabrication Plant, gathered under a couple of legal entities. Dana, the group operations lead, opens Atlas and forks a blank view called "DOCS Weekly executive scorecard." She drags every plant into the "Sites" rows, then adds "Completed jobs value", "OEE", "Incidents open", and "Training compliance" as columns. She sets the Period to "Day · WTD · MTD · QTD" so each plant shows the day, week-to-date, month-to-date, and quarter-to-date figures next to one another.
Because Dana has the "Manage Atlas views" permission, she uses "Set targets…" to enter each plant's monthly "Completed jobs value" and "OEE" targets, so the cells begin shading green, amber, and red. She saves the view and shares it as "Everyone" so every plant manager reads the same numbers. On Monday she notices the Leeds Fabrication Plant "OEE" cell has shaded red for week-to-date. She selects the cell, reviews the OEE detail in the drilldown panel, and leaves a one-line note asking the Leeds manager to confirm a changeover delay. The note is waiting on the same cell when the Leeds team opens the board.
What you will see
Once a view has at least one metric and is saved, you get a single, shareable grid that compares every site side by side, refreshes its reconstructed closed-period values every 15 minutes, shows how old the latest successful saved values are, shades each cell against its target, and lets anyone with access drill into the source records and read shared notes. Switching the Cells picker reformats the board instantly, while expanding a metric reveals its Day, WTD, MTD, and QTD values.
Feature state and limitations
- Beta. Atlas is in beta, as the navigation badge shows. The capabilities on this page are present today, but expect labels and behaviour to keep changing; do not treat any detail here as a permanent guarantee.
- History can be unavailable. A state cell shows
#N/Awhen the source history does not cover its day-end boundary. Group and all-sites rollups also show#N/Awhen any included site is unavailable, so a partial estate is never presented as a complete total. - Shading needs targets. Cells only take on green, amber, and red status shading where a target exists for that metric and site. Metrics without targets still display, just without the colour cue.
Money metrics elsewhere in Atlas also use these payable job totals that include assigned order services.
Troubleshooting
- Atlas will not open, or you cannot see it. Opening Atlas requires the "View Atlas" permission (
atlas.view). If the module is missing from your navigation or the page will not load, ask an administrator to grant you a role that includes it. - There is nothing to compare. If your organization has only one plant, Atlas has a single site row to show. Add the other plants so there is more than one row to weigh against each other.
- A view tab shows a lock. A locked tab means the view is "Restricted" and you are not on its access list. The board reads "No access to this view"; select "Request access" to notify the owner, and the button changes to "Requested" once your request is sent.
- A prompt warns about unsaved changes. Switching tabs while a view has unsaved layout edits raises an "Unsaved changes" prompt. Choose to save or discard the edits before moving on so you do not lose your work.
- The freshness line says "Update delayed". Atlas is keeping the last successful values visible because a scheduled update did not complete. Select Retry when it appears, or continue using the displayed values while Atlas tries again automatically.
- The freshness line says "Live preview". The saved result is still being prepared or the view has unsaved edits. Atlas is calculating the visible values live until a complete saved result is ready.
- A period cell shows
#N/A. Open its tooltip to see the missing site, source, or history boundary. Atlas does not replace missing historical coverage with zero.
Related guidance
- Review cross-plant performance in Atlas — the step-by-step task guide for building and reading a comparison.
- KPIs — define the KPIs that Atlas can then surface as metric columns.
- Insights and visual management — the wider set of dashboards, boards, and analytics Atlas sits within.
Open a board
Find a board in the boards picker and open it to view its live widgets, in the current window or a new one.
Review cross-plant performance in Atlas
Use Atlas to compare every plant side by side — build a saved pivot of sites against metrics, read it by period, drill into any cell, and share it with your team.