KPIs
How KPIs in Bulk turn shop-floor data into tracked performance measures, and where to find the guides for categories, KPIs, targets, reports, and AI assistance.
A KPI (key performance indicator) is a single, named measure of how a part of your operation is performing — for example on-time delivery, scrap rate, or safety incidents. In Bulk, KPIs give each site a shared set of numbers to track day by day, compare against a target, and display on the boards your teams gather around.
This page explains how KPIs fit together and points you to the step-by-step guides for each part. If you are setting up KPIs for the first time, read this page first, then work through the linked guides in order.
How KPIs work in Bulk
Every KPI brings four things together:
- A definition — the name, unit, and how values roll up over a period. Aggregation can be a combined total, an average, the peak value, or the lowest value.
- A data source — where the number comes from. A KPI can be entered by hand, or pulled automatically from audits, production, or incidents. A Formula KPI combines other KPIs into a calculated result.
- A target — the number you are aiming for on a given day, together with a goal direction: higher is better, lower is better, or an exact match.
- An actual — the value recorded for a day. Bulk compares the actual against the target and the goal direction to decide whether the KPI is on track.
KPIs are grouped into categories so related measures sit together, and each KPI is scoped to one or more entities (a site, plant, or team). Because KPIs are entity-scoped, the targets you set and the values you record always belong to a specific site. This keeps the numbers meaningful when one organisation runs several plants.
Entities decide which KPIs you see
Targets and reports are always tied to the entity you have selected. If a KPI does not appear when you plan targets or enter a report, check that it is scoped to the current site and that you have the right site selected.
Before you start
KPI work is split by permission, so different roles do different parts:
- View KPIs — needed to see KPI values on teamboards and dashboards. Granted to admins, managers, and the read-only Dashboards role.
- Enter KPI values — needed to submit a daily report of actual values. Granted to operators as well as admins and managers.
- Create, edit, and delete KPIs and categories — the setup work. Granted to entity admins, managers, and super users.
- Manage targets — set and adjust the numbers each KPI aims for. Granted to entity admins, managers, and super users.
If a page or action described here is missing for you, your role most likely does not include that permission. Ask an administrator to adjust your role or to make the change for you.
You also need at least one entity selected. Bulk uses your selected site to filter the KPIs, targets, and reports you work with.
Where to find KPIs
KPIs live in two places:
- Setup is under Settings → KPI, which has three areas: Categories, Management, and Targets. This is where administrators define the KPIs and the numbers they aim for.
- Day-to-day use is under Teamboards. Choose New report to record actual values for a site and date, and open Teamboards to see KPI status on the boards your teams review.
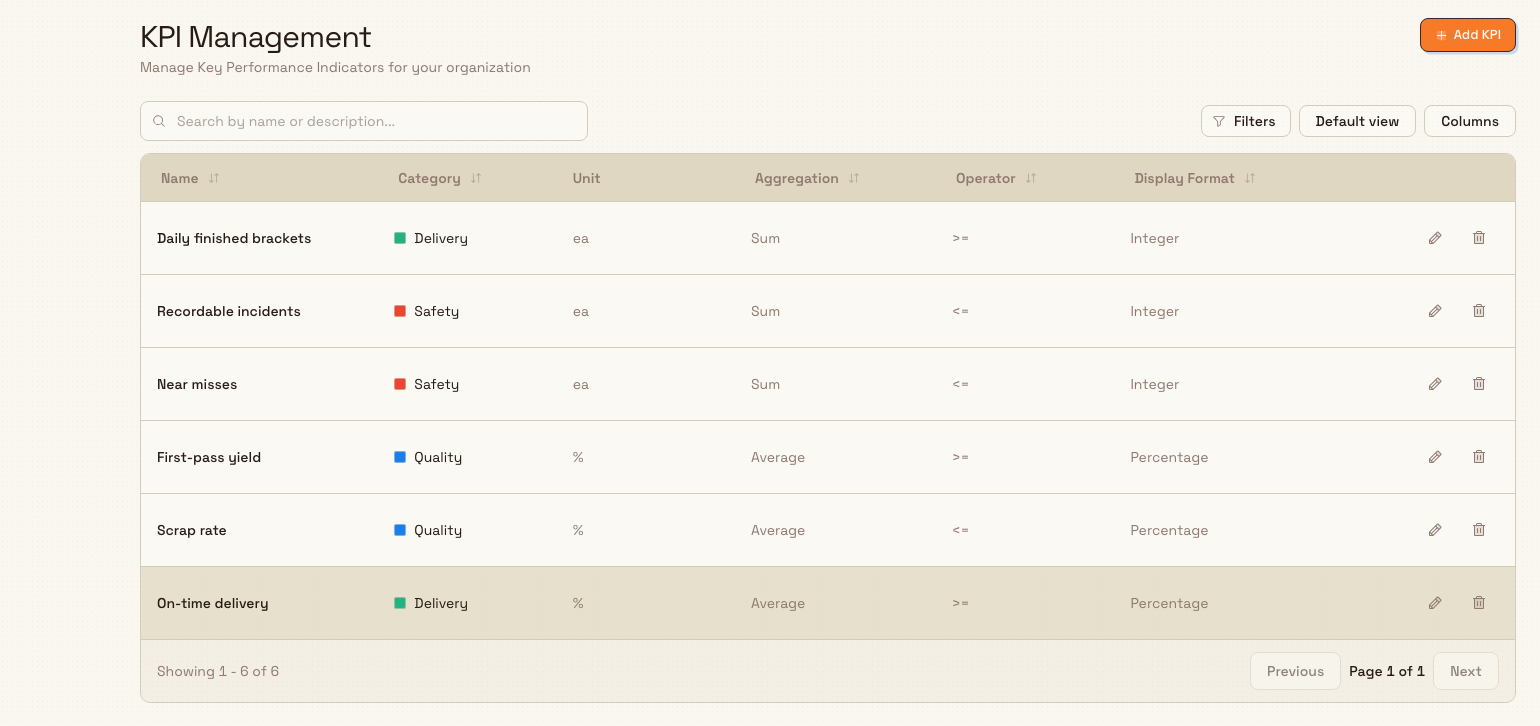
The KPI Management page is the catalogue of every KPI at your organisation. It lists each KPI with its category, unit, aggregation, operator, and display format, and it is where you add, edit, restore, or remove KPIs.
kpi.overview-01
What you can do
Each task below has its own guide. Follow them in order the first time you set up KPIs.
Organise KPIs into categories
Categories group related KPIs — for example Safety, Quality, and Delivery — so boards and reports stay tidy. Create and colour your categories before you build KPIs, because every KPI is filed under one. See Manage KPI categories.
Create and manage a KPI
The Add KPI button opens a guided wizard with five steps: Basics, Measurement, Data Source, Entities, and Review. You choose the name and unit, how values aggregate, where the number comes from, and which sites the KPI applies to. See Create and manage a KPI.
Set targets
Targets are planned on a week-based matrix, one day at a time, per KPI and site. You can copy a week, quick-fill a week, or clear it, which makes it fast to set a steady daily goal across a month. See Set KPI targets.
Enter values and review reports
A New report records the actual values for one site and date across all of that site's KPIs at once. Bulk then compares each actual against its target so the KPI shows as on or off track. You can review the full history of changes to a KPI on its detail page. See Review KPI detail and reports.
Get help from the KPI Assistant
The KPI Management page includes an AI assistant that can help you draft and refine KPIs from a plain-language description, so you do not have to build every definition by hand. See Use AI assistance with KPIs.
Example: an SQDCP board at Granite Peak
Granite Peak Manufacturing wants its Leeds Fabrication Plant to run a daily stand-up around a lean SQDCP board (Safety, Quality, Delivery, Cost, People). Dana, the plant administrator, sets it up like this:
- In Settings → KPI → Categories, Dana creates categories for Safety, Quality, and Delivery and gives each a colour.
- In Settings → KPI → Management, Dana adds KPIs such as Recordable incidents (Safety, lower is better), First-pass yield (Quality, higher is better), and On-time delivery (Delivery, higher is better), scoping each to the Leeds Fabrication Plant.
- In Settings → KPI → Targets, Dana sets a daily target for each KPI for the coming month, using quick-fill to repeat the same weekday goal.
- Each morning, the shift lead opens Teamboards → New report, picks the Leeds Fabrication Plant and yesterday's date, and enters the actual numbers.
From then on, the team sees at a glance which measures met their target and which need attention — without anyone calculating the numbers by hand.
What to expect
Once KPIs are defined, targeted, and reported, Bulk keeps the running comparison of actual against target for you. KPI status appears on teamboards and dashboards, and each KPI widget loads independently so one unavailable measure does not hold up the others. The detail page keeps a full audit trail of changes, and every value stays tied to the site it belongs to. Deleting a KPI removes it from the catalogue and from teamboard widgets, but its targets, records, and annotations are kept so you can restore it later from the Deleted view.
Feature availability and limits
KPIs are generally available. A few things are worth knowing before you build:
- KPIs, targets, and reports are per entity. There is no single cross-site KPI value; roll-ups across plants are handled by the Atlas module rather than by an individual KPI.
- A Formula KPI can only combine other, non-formula KPIs. Build the underlying measures first, then create the formula that references them.
- Automatic sources (audits, production, incidents) calculate from data already in Bulk. If that upstream data is missing for a day, the KPI has nothing to show for that day.
- The automatic Buffer value production source uses complete production-order totals and includes Reserved, New, Open, and In Progress orders. Completed, cancelled, and deleted orders are excluded from the current buffer.
Automatic value KPIs use payable job and order totals that include assigned order services.
Dates and time zones
KPI target and report dates use the KPI's plant calendar and stay on the selected day, even when someone views them from a computer in another timezone. Daily values close at that plant's local day boundary, while weekly targets and totals use the organization's shared week-start rule.
Related guides
Use the asset board
Open and read the asset board, a TV-ready live view of shop-floor asset status, output, and efficiency for one site.
Manage KPI categories
Group your KPIs into named, color-coded categories such as Safety, Quality, and Delivery so every metric stays organized and easy to find across your plants.