Beta
Review cross-plant performance in Atlas
Use Atlas to compare every plant side by side — build a saved pivot of sites against metrics, read it by period, drill into any cell, and share it with your team.
Atlas is the cross-plant executive dashboard in Bulk. It lays out your sites down the rows and your chosen metrics across the columns, so you can scan how every plant is performing against the same measures at a glance. Instead of opening each plant's dashboards one at a time, you read the whole organisation in a single grid — hence the tagline you see under the page title, "Every site, side by side."
Use Atlas when you need an operations-wide picture rather than the detail of one plant: a morning review across the group, a weekly performance call, or a quick check on which site is falling behind on a shared target. Each layout you build is saved as a named view (a tab), so different audiences can keep their own scorecards.
Atlas is in beta
Atlas is a beta feature. In the left navigation it appears under Modules with a Beta badge. The capabilities described here are live in the product, but the feature is still evolving, so expect refinements to the layout and controls over time. This page describes the behaviour as it exists in the current build.
Before you start
To open Atlas you need the atlas.view permission. In a standard Bulk role setup this permission is granted to the Entity admin, Manager, and Dashboards roles. If Atlas is missing from your navigation, ask an administrator to add a role that grants it.
Two further capabilities are gated separately:
- Setting monthly targets requires the atlas.manage permission (granted to Entity admin in the standard setup). Anyone with atlas.view can still read views that use targets; they simply cannot edit the target numbers.
- Editing a specific view depends on that view's own access. The person who creates a view is its owner and can always edit it. Other people can edit only if the owner shares it with edit rights.
Atlas compares the sites (legal entities) that exist in your organisation. If your Bulk account has a single site, Atlas still works, but the cross-plant comparison is most useful once you operate more than one plant.
Open Atlas
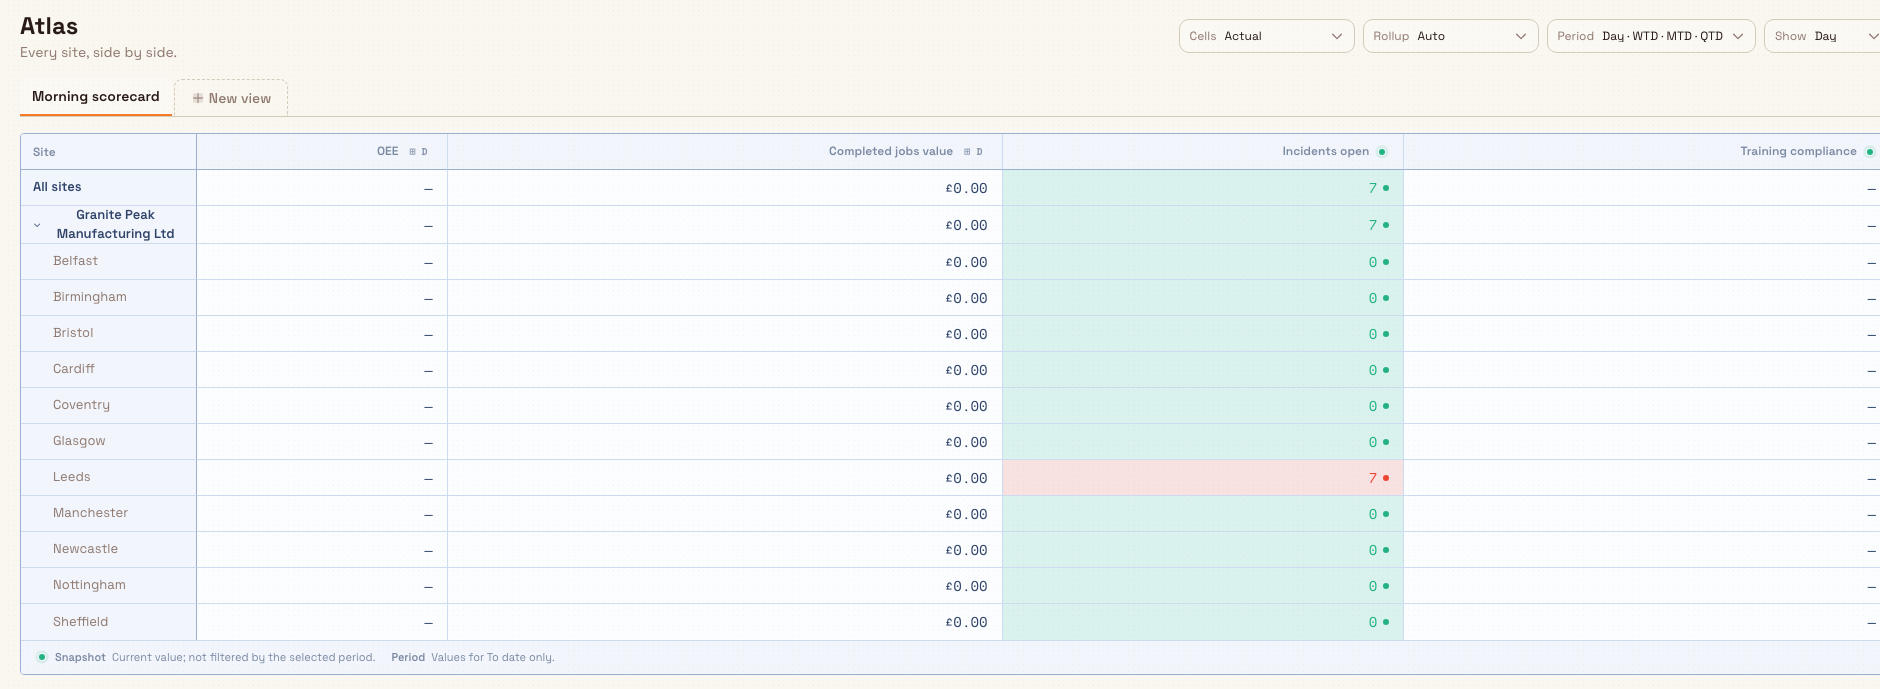
Select Atlas in the left navigation, under the Modules group. The page opens full width. The heading reads Atlas, and a row of saved-view tabs sits below it.
The first time you open Atlas — before any view exists — you see a Welcome to Atlas panel with a Create your first view button. Selecting it starts a blank view that you can shape with the fields rail described below.
atlas.cross-plant-performance-01
How an Atlas view is built
Every Atlas view is a pivot with three moving parts.
Rows are your sites. Atlas groups the rows by legal entity. An optional All sites total row sits at the top and rolls the metrics up across every plant; each plant then appears as its own row beneath its group.
Columns are metrics. You choose which measures to compare. Atlas ships a catalogue of around thirty built-in metrics organised by category — Inventory, Production, Safety, Training, Tasks, People, Audits, Quality, and OEE — covering measures such as OEE, Completed jobs value, Stock on hand value, Incidents open, Audits overdue, Training compliance, and Active headcount. You can also add any KPI you have defined in the KPIs module as a column, so custom measures sit next to the built-ins.
The readbar reformats the whole sheet. Three compact pickers at the top right change how every cell reads at once — there is no per-cell configuration:
- Cells chooses what each cell shows: Actual (one number plus a status dot), Plan · Act · Δ (plan above, delta below), or Δ to target (the signed gap only — the fastest scan).
- Rollup chooses how the total and group rows combine sites: Auto (picks a sensible method per metric), Sum (total across sites), Average (simple average of sites), or Weighted avg (weighted by each site's volume). Some metrics only allow certain rollups; the picker disables the options that do not apply.
- Period chooses the time window: the to-date preset Day · WTD · MTD · QTD (Day, week-to-date, month-to-date, and quarter-to-date shown together), a single preset such as Yesterday, This Week, This Month, This Quarter, or YTD, or a Custom… date range. When the Day · WTD · MTD · QTD preset is active, an extra Show picker lets you choose which of the four sub-periods the collapsed columns display.
Some metrics are snapshots rather than period totals. These carry a Snapshot badge, and their value is the current state — "Current value; not filtered by the selected period" — so changing the period does not change them.
Shape the layout
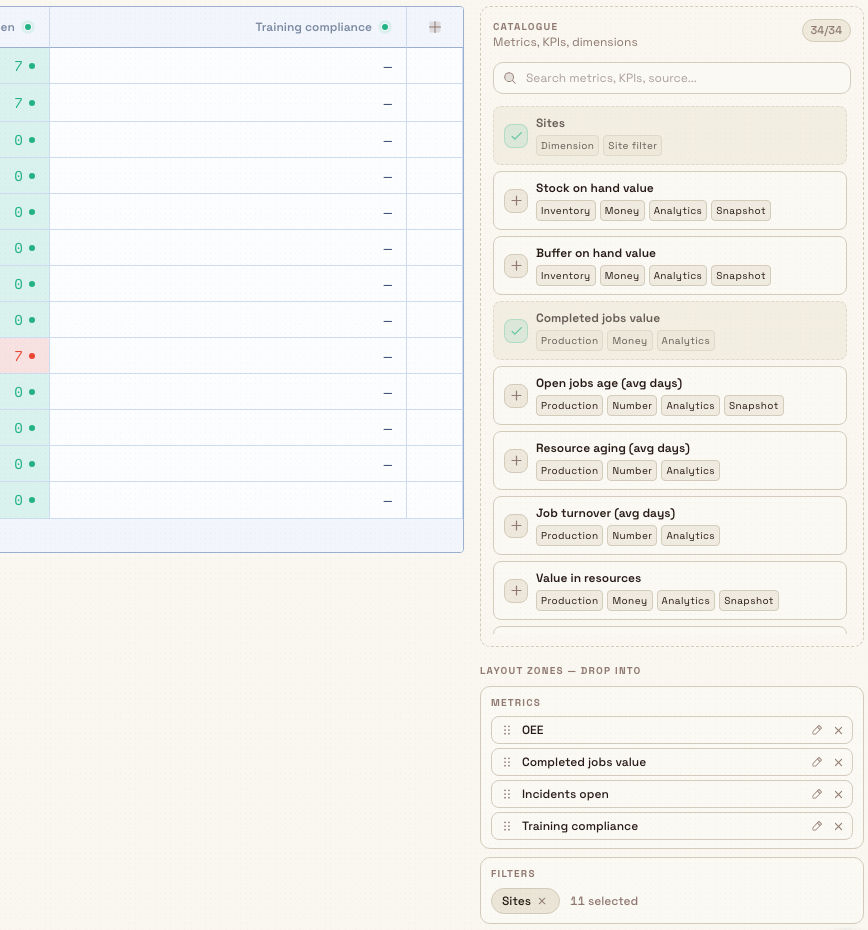
To change which metrics and filters a view uses, turn on layout editing (the edit layout action on the active view's tab, or the add-metric control in the sheet). The fields rail opens alongside the pivot.
The rail has two parts:
- A Catalogue of everything you can add — metrics, KPIs, and the Sites dimension — with a search box ("Search metrics, KPIs, source..."). Each catalogue row is tagged with its category and source, where Live metrics read current data and Analytics metrics come from the analytics snapshots.
- The Layout zones — drop into area, with a Metrics zone (the columns) and a Filters zone. Drag a catalogue row into a zone, or select it to add it without dragging. Add the Sites field to the Filters zone to narrow the view to specific plants; the site picker then lets you choose All sites or a subset.
Each metric column has a settings menu where you can give it a custom Label and, for built-in metrics, open Monthly targets.
atlas.cross-plant-performance-02
Save it as a view
Layout changes stay local until you save them. While a view has unsaved edits its tab shows a dot, and a Save view button (with Discard beside it) appears in the header. Selecting Save view persists the layout; Discard reverts it. If you try to switch tabs with unsaved changes, Atlas asks whether to Stay here, Discard & switch, or Save & switch.
Create additional views from the New view control at the end of the tab strip: Duplicate current view copies the active layout, or Blank view starts empty. A view's own tab menu also lets you rename, duplicate, delete, share, and set it as your default.
Read the cells and drill in
The status colour of each cell — good, mid, or bad — reflects how the value compares to its target, taking into account whether higher or lower is better for that metric. Cells without a target show a neutral dot. Targets come from the metric's monthly targets (see below) or, for KPI columns, from the KPI's own target.
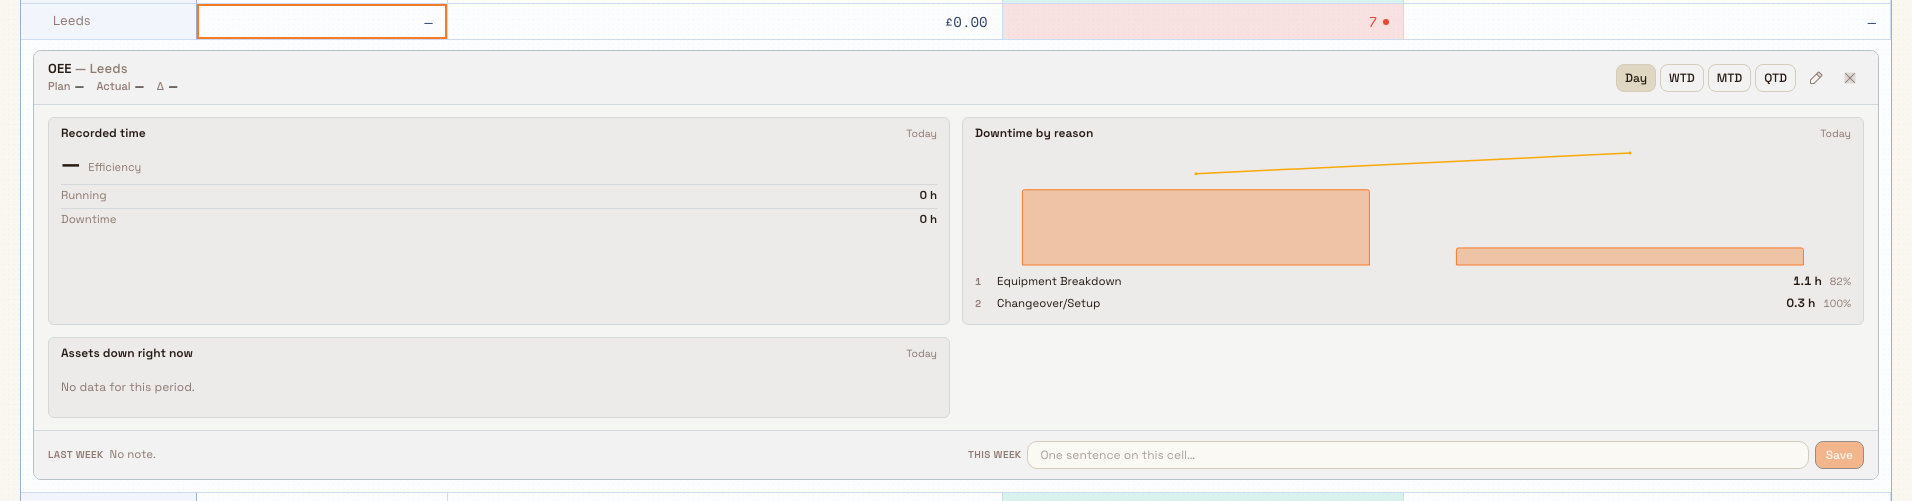
Select any cell to open a drilldown panel for that plant, metric, and period. The panel shows one or more charts that break the number down — for example, the reasons behind a downtime figure or the trend behind a completed-jobs value — along with a note field where you can record context for the team. If you can edit the view, an edit control lets you add, reorder, or reset the panel's charts, and those choices save with the view like any other layout change.
Set monthly targets
Monthly targets drive the heat shading and the plan-versus-actual cell modes. For a built-in metric, open its column settings and choose Set targets… under Monthly targets. The targets editor shows your sites against a three-month window, with arrows to move quarter by quarter, and you enter a target per site per month.
Editing targets requires the atlas.manage permission. If you have atlas.view but not atlas.manage, Atlas hides the Set targets… action so you are not offered inputs that would fail to save.
Atlas targets and KPI targets are separate
The monthly targets you set here belong to Atlas built-in metrics. KPI columns bring their own targets from the KPIs module. See the related links below for managing KPI targets.
Share a view
Open the Share action from a view's tab menu (available to the owner and to anyone the owner has given edit rights). The Access picker offers three modes:
- Private — only the owner can see the view.
- Everyone — everyone with Atlas access can see it.
- Restricted — only the chosen Roles and People can see it. Saving replaces the current restricted list.
When someone without access opens a restricted view they see a No access to this view panel with a Request access button; the request notifies the owner. The owner then approves or denies pending requests from the same share dialog, under Access requests.
Example: Granite Peak's morning scorecard
Granite Peak Manufacturing runs several plants, including the Leeds Fabrication Plant. Dana Winters, the operations lead, wants one screen for the daily production call.
Dana opens Atlas, selects New view, then Blank view, and names it "Morning scorecard". In edit layout, Dana drops OEE, Completed jobs value, Incidents open, Audits overdue, and Training compliance into the Metrics zone, leaving the Sites filter set to All sites so every plant appears. Dana sets the readbar to Cells: Δ to target, Rollup: Auto, and Period: Day · WTD · MTD · QTD, then selects Save view.
Because OEE matters most, Dana opens the OEE column settings, chooses Set targets…, and enters a monthly OEE target for each plant for the current quarter. Now the OEE cells shade green where a plant is at or above target and red where it is behind.
On the call, one plant's OEE cell is deep red. Dana selects the cell, and the drilldown panel shows downtime broken down by reason for that plant, making the cause obvious. Finally Dana shares the view as Restricted to the Manager role so every plant manager sees the same scorecard the next morning.
atlas.cross-plant-performance-03
What you can expect
After building and saving a view, you have a reusable scorecard that any permitted teammate can open. The readbar reformats every cell together, so switching period or cell mode is instant and consistent across all plants. Targets you set turn the grid into a status board, and any cell drills down to the detail behind it. Views persist as tabs until you delete them; deleting a view removes it for everyone it was shared with, but never changes the underlying production data.
Limitations and feature state
- Beta feature. Atlas is in beta and carries a Beta badge in the navigation. Controls and layout may change as the module matures; treat this article as current rather than final.
- Permission gating is enforced by the server. The atlas.view and atlas.manage permissions, and each view's own sharing, are enforced in the backend, not only hidden in the interface. Missing a permission means the corresponding action is unavailable, not merely invisible.
- Rollups are constrained per metric. Not every rollup applies to every metric; unavailable options are disabled in the Rollup picker rather than producing a misleading total.
- Snapshot metrics ignore the period. Metrics marked Snapshot always show the current value and do not respond to the Period picker.
- Verification note. The behaviours above are drawn from the current Atlas source. Exact on-screen values, the set of seeded plants, and which KPIs appear depend on your data and will be confirmed against the shared documentation environment when screenshots are captured.
Troubleshooting
- Atlas is not in my navigation. Your roles do not grant atlas.view. Ask an administrator to assign a role that includes it (for example Manager or Dashboards).
- A view shows "No access to this view". The view is Restricted and you are not on its list. Select Request access to notify the owner, or ask them to add you.
- I cannot set targets. Setting monthly targets needs atlas.manage. If Set targets… is not offered, you have view access but not manage access; ask an Entity admin to set the targets or grant the permission.
- A rollup option is greyed out. That metric does not support the selected rollup. Choose Auto, or pick a rollup the metric allows.
- Changing the period does not move a value. That metric is a Snapshot (current-state) measure and is not filtered by the period. Look for the Snapshot badge on the column.
Related guidance
Atlas
Atlas is Bulk's cross-plant executive dashboard: build saved views that compare every site side by side across the metrics and KPIs that matter, then share them with your team.
Digital Twin
A live 3D model of your plant floor that shows each machine's status, OEE, and current job in real time, scores zones by 5S, and lets you build the layout and show it on a wall display.