Review the Utilization Grid
Open the Utilization Grid dashboard for an hourly view of every asset across one site day, colored by running, idle, and each downtime reason.
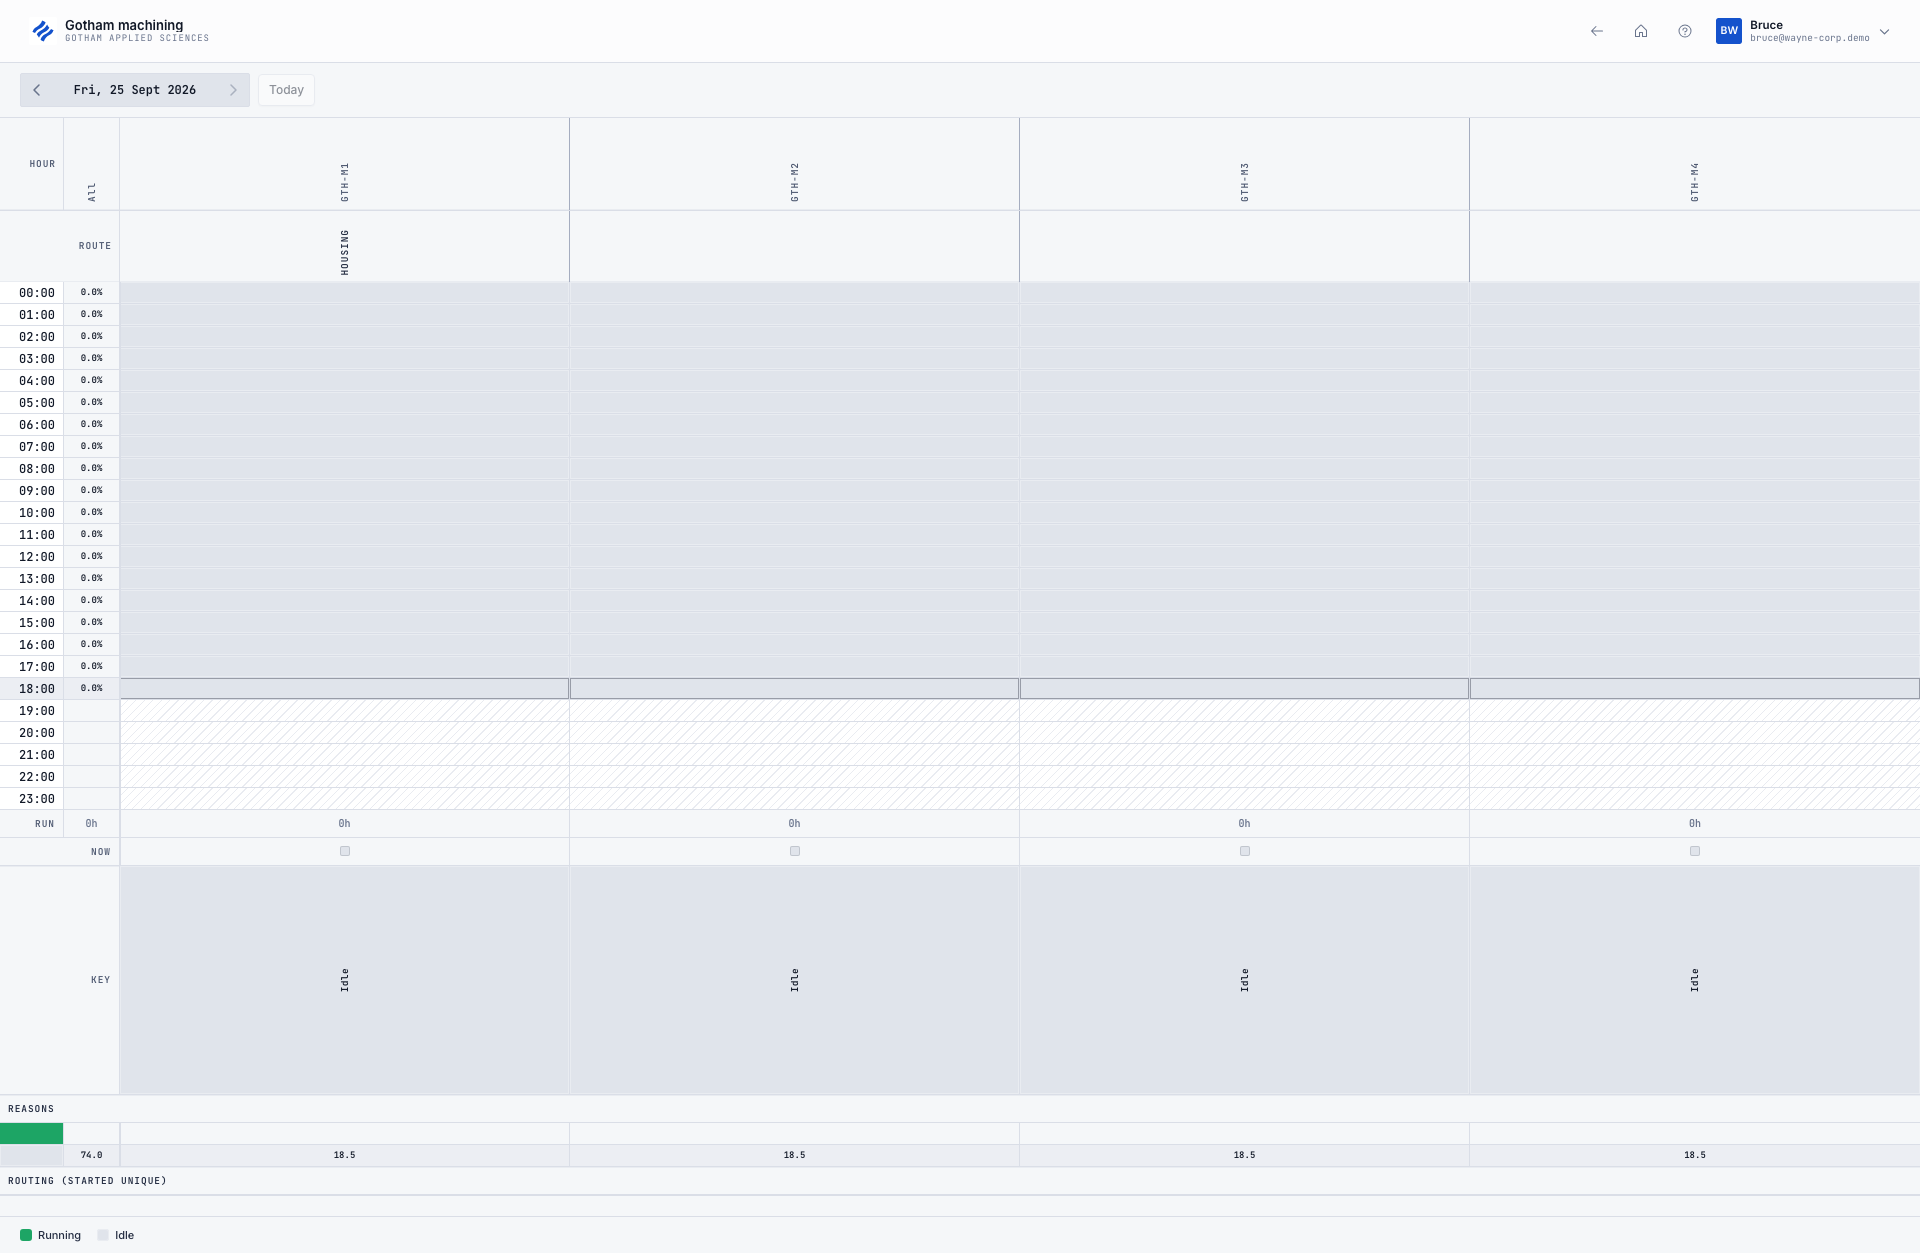
The Utilization Grid is card DASH-UTIL on the Dashboards picker. It opens at /dashboards/utilization-grid. The sheet is one site day: each row is an hour, each column is an asset on the board you pick, and each cell is colored by what that asset was doing.
Use it when a huddle wants the whole board in one view, not a single machine timeline. The card text is "Every asset by hour across one day, colored by running, idle and each downtime reason".
dashboards.utilization-grid-01
Before you start
- Permission to open the sheet. The day grid loads only for View OEE analytics (
analytics.view_oee). Built-in roles that include it are Super user, Entity admin, Manager, and Dashboards. The display role Dashboards viewer includes it too. Without it, the query is refused and the screen heading is "You don't have access here". That screen names Analytics, View OEE, and the codeanalytics.view_oee. An administrator grants View OEE analytics under Settings, Organization, User Roles. - An asset board with assets. Columns are the active assets on the selected board. If the site has no boards, the sheet says "No boards configured" and "Create a board in settings and the grid fills in as timers and downtime are recorded." If the board is empty, it says "No assets on this board" and "Add assets to this board in settings to start showing utilization here." Go to settings opens Asset board settings. You can view that list with View OEE analytics. Creating or editing a board needs Manage OEE dashboards (
analytics.manage_oee_dashboards). - Recorded time. Cells come from production timers and downtime events already stored for the site. Until those exist, hours stay idle or not yet started.
This board is read-only
The grid does not start timers, change downtime, or edit the board. Record time on the station. Set reason colors under downtime reasons. Change which assets appear under Asset board settings.
Open the dashboard
- Open Dashboards from Home. The picker heading is "Open a dashboard."
- Find the Utilization Grid card (code
DASH-UTIL). Double-click it, or select it and choose View DASH-UTIL. Open in new window opens the same route in another tab. - The board opens full width, with no sidebar. Use Back to dashboards to return to the picker.
The day and the board are stored in the page address (date and board), so a view you build is shareable. The document title is "Utilization Grid".
Choose the day and board
Day controls sit on the left. The group is labeled Day.
- Previous day and Next day move one site calendar day. Next day and Today stay disabled on today, so the controls do not step into tomorrow.
- The date shows the weekday, day, month, and year in the site time zone. Before that label arrives, it reads "Loading". The sheet body reads "Loading..." while the grid is still coming in.
- Today clears
datefrom the address and returns to the site's today. The browser time zone does not pick the day. - The header shows the board name. On a wide screen, the site name sits under that name. With more than one board, open Switch board and pick another. A star marks the default. With one board, the name stays put and the menu does not open. If no board is resolved, the header reads "Select board".
- The choice is kept as
boardin the address. A missing or deleted board falls back to the default board, then to the board updated most recently. - Hour labels run from
00:00to23:00. On a daylight saving change, one row can be empty or two hours wide. That follows the site clock.
Read the sheet
Hour and Route display in capitals, and they stay pinned on the left with All while you scroll. Asset codes are the column titles, turned on their side. Hover a code for the asset name. All means every asset on the board.
Route, under the codes, is the process type loaded on that asset right now. The cell shows the type code, or the name when the code is empty, for the type with the most distinct loaded jobs. A plus count, such as +2, means more types are loaded. Hover for each routing and its job numbers. The cell is empty when nothing is loaded. Jobs with no process type do not take the cell. They show in the hover as No routing.
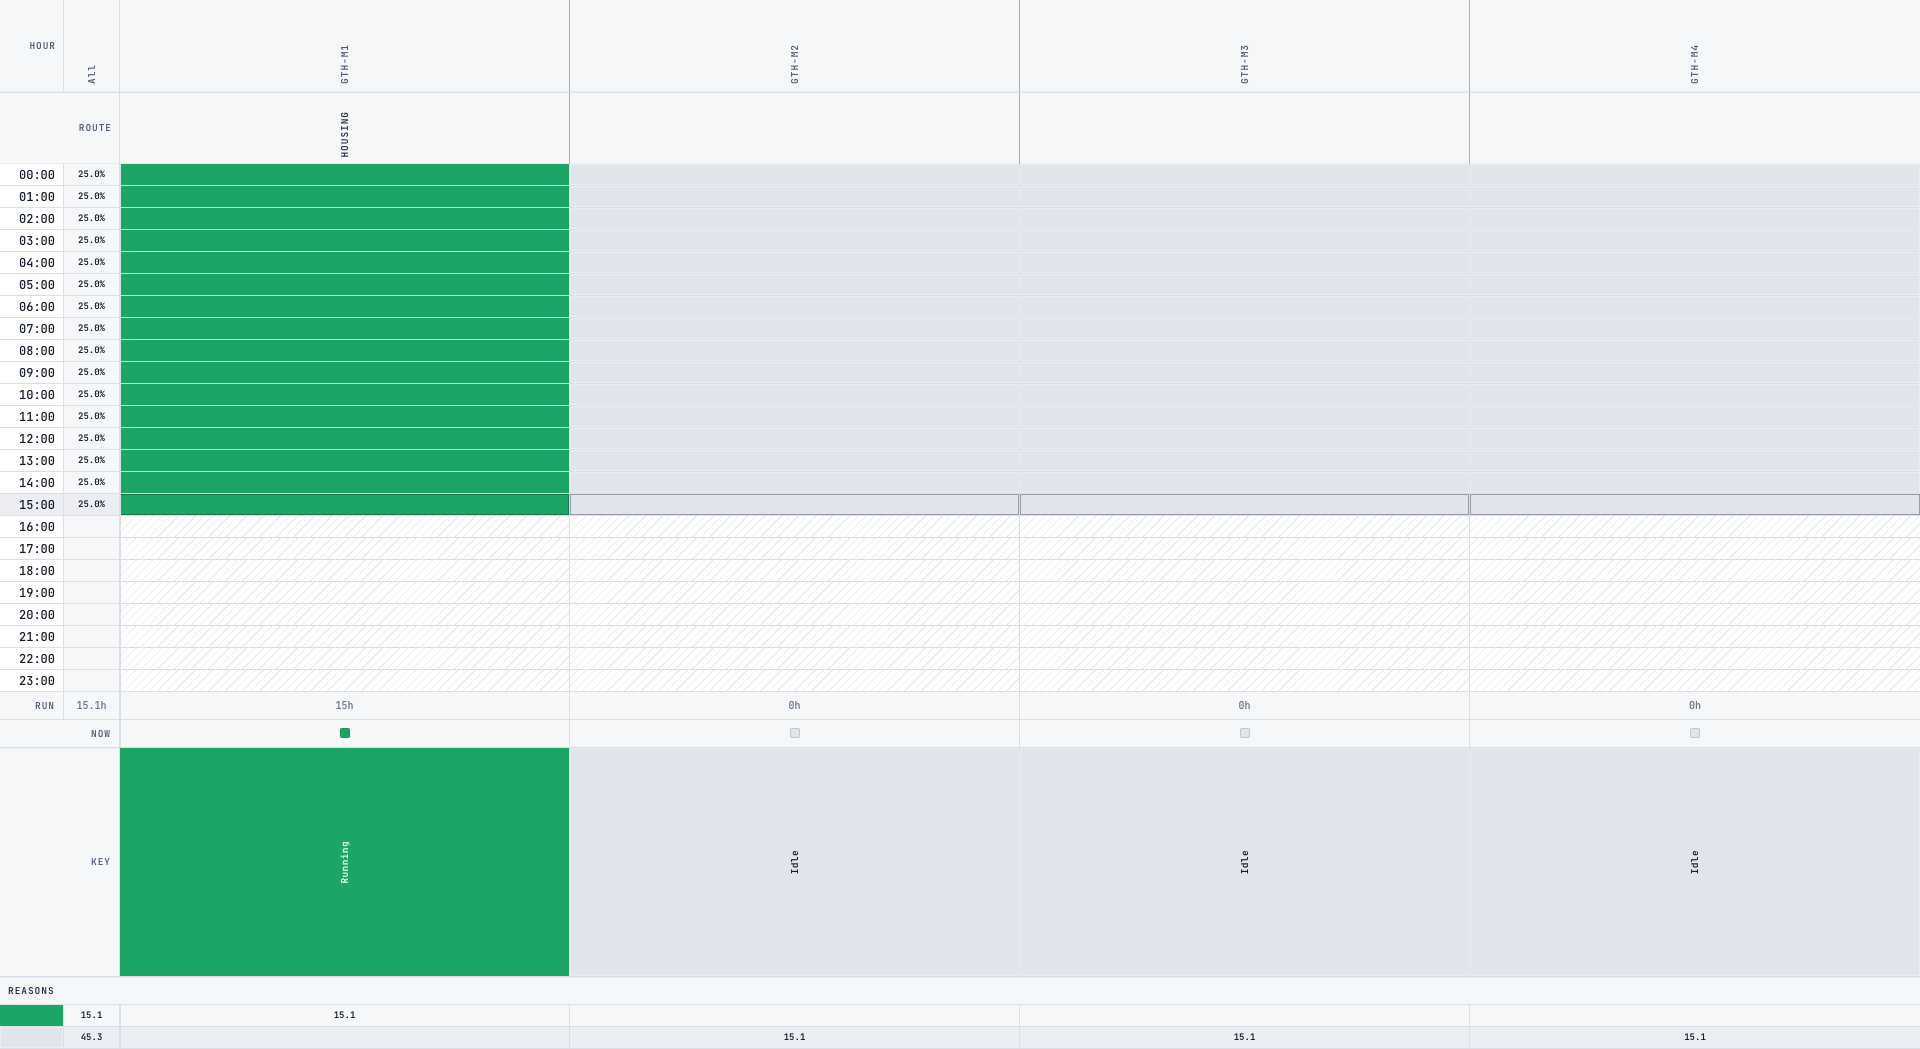
Each body cell is one fill: the state with the most time in that hour. On a tie, idle loses to any other state. Hover lists every state in that hour, with minutes.
- Running uses the success color, green on the standard theme. A downtime event covers a running timer when they overlap. If two downtime events overlap, the one that started later wins. Time with neither is idle.
- Idle is a quiet wash with a thin ring.
- Each downtime reason uses the color set on that reason. The name in the hover is the reason name. A reason with no color uses the warning color.
- Hours that have not started are a hatch, not a solid fill. The state name is Not yet. Those hours are blank in All.
All shows the running share of available time for that hour, to one decimal. The hover says "running share of available time". Future hours are blank. The current hour row is outlined so you can keep your place.
The Colour key sits under the sheet once the board has assets. It lists Running, each downtime reason that has time that day, and Idle. Running and Idle stay on the key even at zero. A downtime reason joins the key only when the day total rounds to at least a tenth of an hour. Not yet is not on the key. A shorter slice can still appear in a cell hover.
Footer labels also display in capitals:
- Run is running hours. Under each asset the figure is a whole hour. The All cell keeps a tenth when the total is not whole. Hover that Run cell for the tenth and that asset's utilization percent.
- Now is a small square in the color of the state right now. Hover for the reason name. On today, notes from an open downtime event are included.
- Key stacks that asset's colors for the day. A name is printed on a slice when the slice is tall enough. Hover for hours and share of elapsed time.
- Reasons is one row per state on the colour key. The left gutter is the color, and the name is the hover. Numbers are hours to one decimal. A zero is blank.
- Routing is running hours by process type, using the same codes as Route. In this gutter the codes display in capitals. The section is omitted when no type has running time. No routing is the row for running time with no process type. A zero is blank.
- ROUTING (STARTED UNIQUE) counts job items whose first timer start falls on this day and on a board asset. A later start of the same item does not count again. A zero is blank.
The sheet updates when timers or downtime change. The current hour also moves every minute.
Let a short board fill the width
Hour and All stay a fixed narrow width, so the pinned labels do not drift as columns change size. Asset columns share whatever width is left, split evenly.
On a board with few assets, each asset column grows and the sheet fills the page. There is no empty band beside the last asset. On a crowded board, columns stop at a small minimum and the sheet scrolls sideways instead of squashing the cells.
Columns are the active assets on the selected board, in asset sort order, then by code. The sheet does not group or filter them by type or line.
dashboards.utilization-grid-02
Review one day with the team
A shift lead at Element's Lancaster site wants yesterday's presses in one view. They open Dashboards, double-click Utilization Grid, and choose Previous day. They set Switch board to the press board. That board has only a few assets, so the columns stretch. Green cells are running. Pale cells are idle. A named stop uses the color from that downtime reason. The All column shows which hours the board was actually running. Reasons turns those colors into hours. They copy the address so the huddle opens the same day and the same board.
Review OEE events
Count downtime events by asset or operator on the OEE events dashboard, then compare categories and read shift, sessions, and jobs for the same range.
Dashboards
Open Bulk's built-in, always-live analytics dashboards for a site from the standalone Dashboards picker, and choose the right board by name, code, or live signal.