Review OEE events
Count downtime events by asset or operator on the OEE events dashboard, then compare categories and read shift, sessions, and jobs for the same range.
The OEE events card (code DASH-OEE-EV) opens a sheet at /dashboards/oee-events. It counts downtime events for the site you already have selected. Each row is one asset, or one operator. On the operator view the same rows also show shift, sessions, and jobs.
The picker card describes it as a count of downtime events by asset or operator, plus operator activity. Use the sheet when you want that count. It is not a timeline, and it is not a ranking of lost hours. Rows run from the most events to the fewest. There is no summary strip above the sheet. You cannot log or edit events here.

dashboards.oee-events-01
Before you start
- Permission to view OEE analytics. The board loads only when you have View OEE analytics (
analytics.view_oee). The built-in Super user, Entity admin, Manager, and Dashboards roles include it. View OEE events (oee_events.view) does not open this board on its own. - The site you want. The header shows the current site and does not let you switch it. Select the site before you open the board. Every count is for that site.
- Recorded downtime events. Each event is a stoppage already logged on an asset. It has one OEE category and one downtime reason. If none started in the range, the sheet says "No events in this period". The note under that title is "No OEE or downtime events were recorded for the selected time range."
Without View OEE analytics, the board is a full-screen access error. The title is "You don't have access here". The message says your account does not have the Analytics View OEE permission (analytics.view_oee). The badge reads Analytics - View OEE. Choose Go back or Go home. An administrator grants the permission under Settings, Organization, User Roles.
This board only counts
The sheet does not create downtime. A stoppage is recorded when someone pauses a machine, or when someone logs a manual event. If the sheet is empty, check that those events were recorded for this site and this range.
Open the dashboard
- Open Dashboards from Home. The picker lists the built-in boards.
- Find the OEE events card (code
DASH-OEE-EV). Double-click it, or select it and choose View DASH-OEE-EV. - The board opens full-width, with no sidebar. Search and notifications in the header are hidden. Use Back to dashboards to return to the picker.
The picture on the picker card is a preview. The board itself is the sheet. The tab and the time range live in the page address, so you can share that link. Search text and column choices do not.
While the numbers load, the tabs stay up and the page says "Loading…". The sheet refreshes on its own. You do not type the counts.
Set the view and time range
Page tabs switch the rows. The sheet heading stays OEE events.
- Assets is the default. One row per asset that has events in the range. The subtitle is "Event counts per asset". The search box says Search assets and matches the asset name.
- Operators groups events by the person who recorded them. The subtitle is "Event counts per operator". The search box says Search operators and matches the name or the shift, including the words "No shift".
Search only hides rows already on the sheet. It does not search reasons. If the range has events but your text matches nothing, the grid is blank. The "No events in this period" message appears only when the range itself has no events.
Time range sits beside Columns. Open it and type to search. The choices are Today, Current week, Previous week, Current month, Last month, 7 days, and 30 days. The board opens on 7 days.
The site time zone sets the calendar bounds. The organization's week start sets Current week and Previous week. Today, Current week, and Current month run from the start of that period up to now. Previous week and Last month are the full previous period. 7 days and 30 days are rolling windows that end now.
An event counts when it started inside the range. An event that started earlier does not count, even if it is still open.
Read the sheet
Column titles show in capitals. A row number at the left starts at 1 for the busiest row. You cannot reorder rows. You can drag a column edge to resize it. The resize tooltip says "Drag to resize, double-click to reset". Assets and Operators each remember their own column choices and widths.
Default columns on Assets, from left to right:
- Asset is the asset name. A missing name shows Unknown. This column stays on.
- Events is how many downtime events started in the range. Events that are still open are included.
- Total time is the closed time for those events, for example
2h 15m. Short totals show seconds or minutes. Longer totals show hours and minutes, then days. Open events add to Events and add nothing here. - Availability, Performance, and Quality split the same events by OEE category. With the default columns, those three counts add up to Events.
On Operators, Asset is replaced by Operator, which stays on. The name comes from the active employee record on this site. If there is no active employee, the profile name is used. If that is missing, the cell says Unknown. Three more columns are on by default:
- Shift stays on. It is that person's default shift. If they have none, the cell says No shift.
- Sessions is how many production timer sessions that person started in the same range, on this site. No sessions shows 0.
- Jobs is how many distinct jobs those sessions include. Several items on one job count once. No sessions shows 0.
A person with sessions but no downtime events in the range does not get a row. Shift, sessions, and jobs appear only beside people who recorded at least one event. Rows with the same event count are ordered by name.
Open events do not add time
Total time sums closed events only. A stoppage that is still open raises Events and leaves Total time unchanged until someone closes it.
Choose columns
Columns lists the columns you can hide. When any are hidden, a number on the button shows how many. On a first visit that number is the loss type and reason columns, which start hidden. If the range has none of those, the button has no number. Reset restores the defaults.
The groups are Counts, Category, Loss type, and Reason. A group checkbox turns every column in that group on or off, and shows a mixed mark when only some are on. Asset, Operator, and Shift are not in the menu. They stay on.
Loss type and Reason appear only for values that occur in this range.
- Loss type columns use the name stored on the event. Standard names, in this order, are Breakdown, Changeover/Setup, Waiting, Planned Stop, Minor Stop, Reduced Speed, Idling, Startup Rejects, and Production Rejects. Custom names follow those. A blank loss type is labelled Uncategorized and comes last.
- Reason columns use the downtime reason name from Settings. A reason with no name is labelled Unknown.
Each event has one category, one loss type, and one reason. Turning a group on splits the same events. It does not add events.
If you turn on one or more Reason columns, the Events number changes. It becomes the sum of the reason columns you left visible, not the full count. Total time, and the category columns, stay on the full set. Leave every reason column hidden when you want Events to stay the full count. That is the default.
Read a count
Hover a count in Events, a category column, a loss type column, or a reason column. Total time, Sessions, and Jobs do not open a panel.
The panel names the row, then the column. The chart is Events by hour of day. It shows how many of these events started in each hour, using the site time zone. The lines under the chart are:
- Events
- Total time, on the Events column only
- Avg duration, or None when that count has no closed event
- Most often, the hour with the most starts, such as
09:00, when any hour is above zero - Sessions and Jobs, on the Events column in the operator view, including when the number is 0
With no reason columns visible, the Events chart stacks reasons. The caption says "Stacked by reason." If more than eight reasons have events, the rest fold into Other. When reason columns are visible, the chart stacks only those reasons. Other count columns are not stacked.
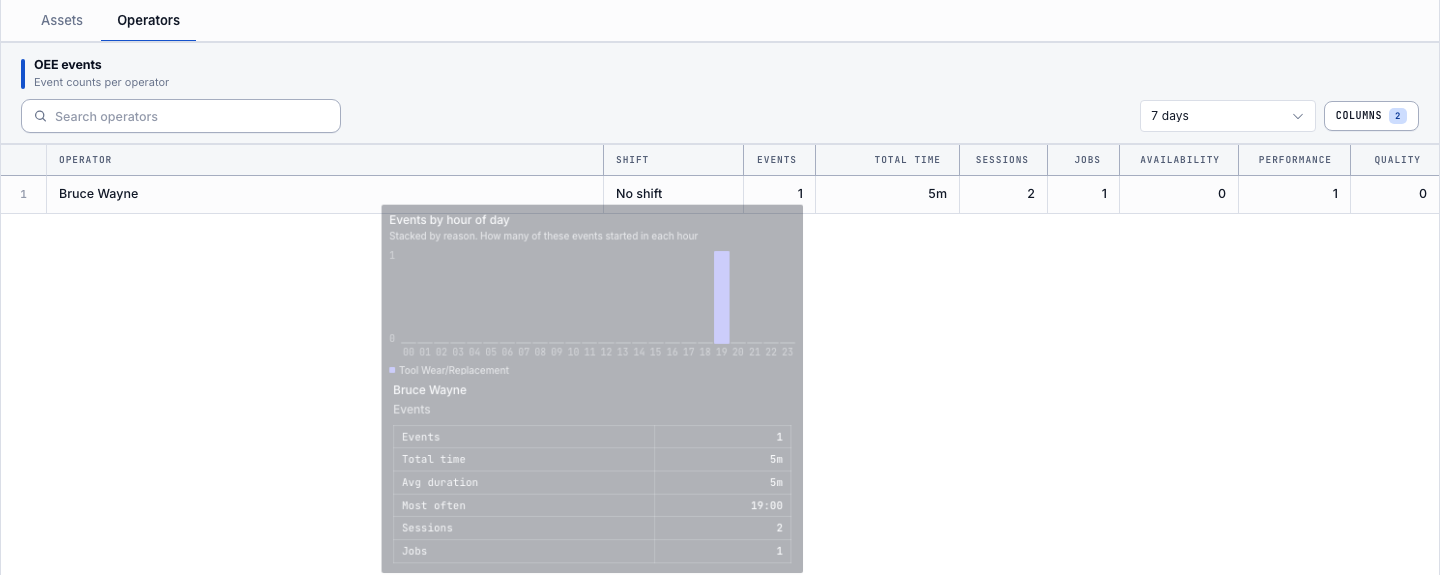
dashboards.oee-events-02
Walk through an example
You want the machines that logged the most stoppages this week. Open Dashboards, double-click OEE events, and leave the range on 7 days and the tab on Assets. The first rows are the assets with the most events. Hover Events on the top row to see which hour the stoppages started. Read Availability, Performance, and Quality on that row to see how the count splits. Switch to Operators to see who recorded the events, which shift they are on, and how many sessions and jobs they started in the same range. Copy the page link so the huddle opens the same tab and the same range.
Use the asset board
Open the asset board for a full-screen live view of one site: station status, loaded jobs, and 24-hour sparklines for activity, efficiency, and output.
Review the Utilization Grid
Open the Utilization Grid dashboard for an hourly view of every asset across one site day, colored by running, idle, and each downtime reason.