Configure reports
Build multi-page PDF reports from widgets, publish them, generate one-off downloads, and schedule email delivery for each site.
Last updated
Reports let you design multi-page PDF layouts for a site, fill them with live production and quality data, and either download a PDF on demand or email it on a recurring schedule. Each report is a document you build from widgets (headings, KPI metrics, charts, tables, and more), then publish when it is ready to generate. Unpublished drafts stay editable; published reports are read-only until you unpublish them.
Use this page when you want a weekly production summary for plant leads, a daily OEE pack for shift supervisors, or a quality overview for quality review: layouts you control, delivered as PDF, without building a one-off spreadsheet each time.
Before you start
Open Settings, expand the Data group, and select Reports. The page address ends in /settings/data/reports.
You need permissions for the selected site:
- View report layouts requires View report templates (
report_templates.view). - Create, edit, publish, unpublish, and duplicate layouts require Create / Edit report templates (
report_templates.create,report_templates.update). - Delete layouts requires Delete report templates (
report_templates.delete). - View schedules and run history requires View report schedules (
reports.view). - Create, edit, pause, and delete schedules require Manage report schedules (
reports.manage). - Run a report now from a schedule requires Run reports manually (
reports.run).
These management permissions are granted by the built-in Super user, Entity admin, Manager, and Master data roles. The Operator role can view layouts and schedules and run reports, but cannot create or change layouts or schedules. If New report, New schedule, or card actions are missing or fail, ask an administrator to adjust your role.
Reports are per site (entity). Each plant keeps its own layouts, schedules, and run history. Switch site first if you need another facility’s reports.
The page description reads: “Build multi-page reports from widgets, schedule delivery, and track every run.”
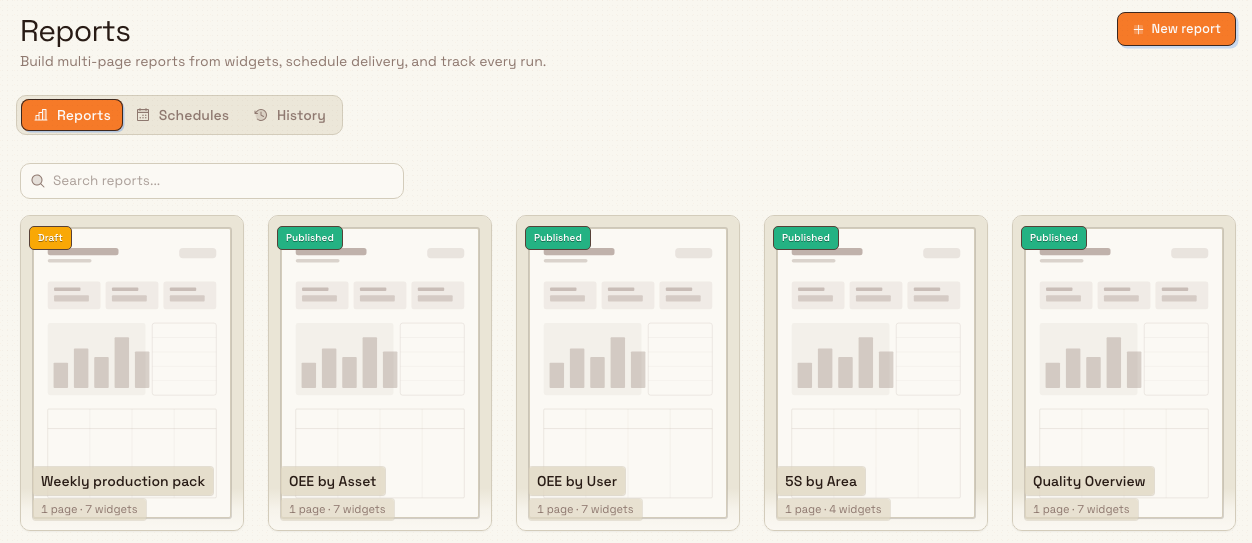
What the Reports page shows
The page has three tabs:
| Tab | Purpose |
|---|---|
| Reports | Build and manage multi-page report layouts (documents). |
| Schedules | Configure when a report runs and who receives the email. |
| History | Review past report runs, status, emails sent, and PDF downloads. |
On Reports, the header shows Template library when you can view layouts, and New report when you can create them. Schedules shows New schedule. History has no primary action.
Reports tab
Each layout is a page-preview card in a grid. A card shows:
- A status badge: Draft, Published, or Archived.
- The report name.
- An illustrative first-page layout preview and relative Edited time. Page count is available on the edited-time tooltip; multi-page layouts also show stacked sheets.
- A right-click context menu with actions that depend on status and your permissions.
If the site has no reports yet, the empty state reads No reports yet with the description “Choose a layout from the Template library or start with a blank report.” New report is there when you can create layouts, and Template library is there when you can view them.
Template library
Template library browses sample layouts. Nothing is saved until you use one. The dialog title starts as Template library, with the description “Browse sample layouts. Nothing is added until you use a template.” Search with Search templates....
Open a sample and the title changes to that layout’s name. Individual Performance Feedback and Performance Report are the employee feedback samples, Site performance summary is the monthly site sample, Operator Shift Review is the operator shift review sample, and Actions overview is the actions sample. The description changes to “Sample data. Create an independent draft to customize this layout.” You can move between pages before you commit. All templates returns the title to Template library. If you can create layouts, Use template saves an independent draft under that name and opens the editor. Viewing a sample does not create a report.
Schedules tab
A Schedules card lists recurring deliveries. Each row shows the report name and type label, cadence (for example Weekdays at 07:00), recipient count, last result, an Active / Paused badge, and a switch to pause or resume. An empty list shows No schedules configured with Create schedule.
History tab
A table of the last 50 runs (or runs for one schedule when you open history from a schedule row). Columns: Date, Report, Type, Status, Sent, and Actions. Filter by report type with All Types. Statuses include Queued, Processing, Completed, Failed, and Cancelled. Empty state: No report runs yet.
Add a report layout
Use New report for a blank layout, or Use template in Template library when you want to start from a sample.
- On the Reports tab, select New report.
- Bulk creates a draft named Untitled report, adds a first page (default A4 portrait), and opens the report editor at
/settings/data/reports/builder/<id>.
In the editor:
- Rename the report on the Report inspector tab (Name and optional Description). Set a default Period if you want Generate and Schedule to pre-select one (for example Last 7 days).
- Drag widgets from the floating dock onto the page. Categories include Basic (Text, Heading, Image), Layout (Divider, Box, Spacer), Metric (KPI metric, Stat group, Gauge, Progress bar), Charts (Chart), and Tables (Data table). Use Browse all / Search widgets… to find a type.
- Select a data widget and bind it to a dataset such as OEE by asset, OEE by operator, Production overview, 5S by area, Quality overview, Pre-use checks, Employee feedback, Site performance by month, Operator shift review, Actions overview, or Zero Harm usage (or leave static with No data (static)). Period options include This year for year-to-date packs and Last 12 months for the twelve full calendar months before the current one. Employee feedback prints individual performance for each workforce employee you include: worked hours, output, output per hour, and first time right, with a daily breakdown and a weekly trend. The name and employee code come from the workforce record. The editor preview shows one person. The PDF repeats the layout once for each included employee. When you schedule the report, Included employees is where you choose those people. The Performance Report sample adds, for each employee: output and re-shots by production mode, right first time with re-shot reasons, utilisation (uptime against downtime), downtime by reason with the average per event, and process cycle targets against the timer and downtime logged. Each figure shows the workforce average and the employee's position, for example 3rd of 12. The downtime table lists the reasons with the most downtime and groups the rest as Other reasons, unless you choose reasons for that table. Its second page keeps the scorecard, daily and weekly overviews and sign-off from the feedback sample. The Operator Shift Review sample uses the Operator shift review dataset. Its first page prints once and compares the included operators: OEE as logged, real OEE from the machine sensor, logged time with the machine idle, time slower than target, time off the bay and total time lost, with hours logged against machine running hours. Then each operator gets a page with a timeline of the rostered shift, a chart of every shot and a table listing, for each shot, how long it should take, the time logged, the time the machine sensor recorded, the whole cycle and the time lost. Bold values are worth a look: logged time with the machine idle of 2 minutes or more, time lost of 5 minutes or more, or a shot with no exposure. When no machine sensor is fitted, real OEE and machine time show No data. When no shift is rostered, the shift and off the bay show Not set. The sample covers Yesterday by default, and a period can cover up to 31 days. Actions overview is scoped to projects. On the Report inspector, Included projects sets that scope. Leave it empty to include every project at this site, or pick projects, including projects at other sites you can access. Each option is the site name, a slash, and the project name. A widget can use its own project selection through Custom reporting scope. Bind a Data table to this dataset and set Rows to Tasks for the task table. That table starts on open tasks (To Do, In Progress, and Review). Under Status, choose Open, Closed (Done and Cancelled), or All, or pick statuses in Show. For Zero Harm usage, choose Safety projects in document settings before previewing or generating the report. Selection follows the saved projects even if you rename them. A widget can use its own project selection through Custom reporting scope.
- Use Refresh preview to load live sample data into the canvas. Edits auto-save while the report is a draft.
- Add more pages from the page strip when you need a multi-page pack. Adjust page size (A4 or Letter) and Portrait / Landscape on the Page inspector tab. When the report repeats its pages for each employee, turn on Print once for a page, such as a summary, that should print once in its place with values across everyone included.
When the layout is ready, return to the Reports list (back control) and right-click the card and choose Publish, or use Publish in the editor header. Publish only after you have checked the layout.
Publish locks the layout
A Published report is read-only. The editor shows Read only and offers Unpublish to edit. Unpublishing returns the report to Draft and pauses any active schedules linked to that layout so you do not keep emailing a layout you are still changing.
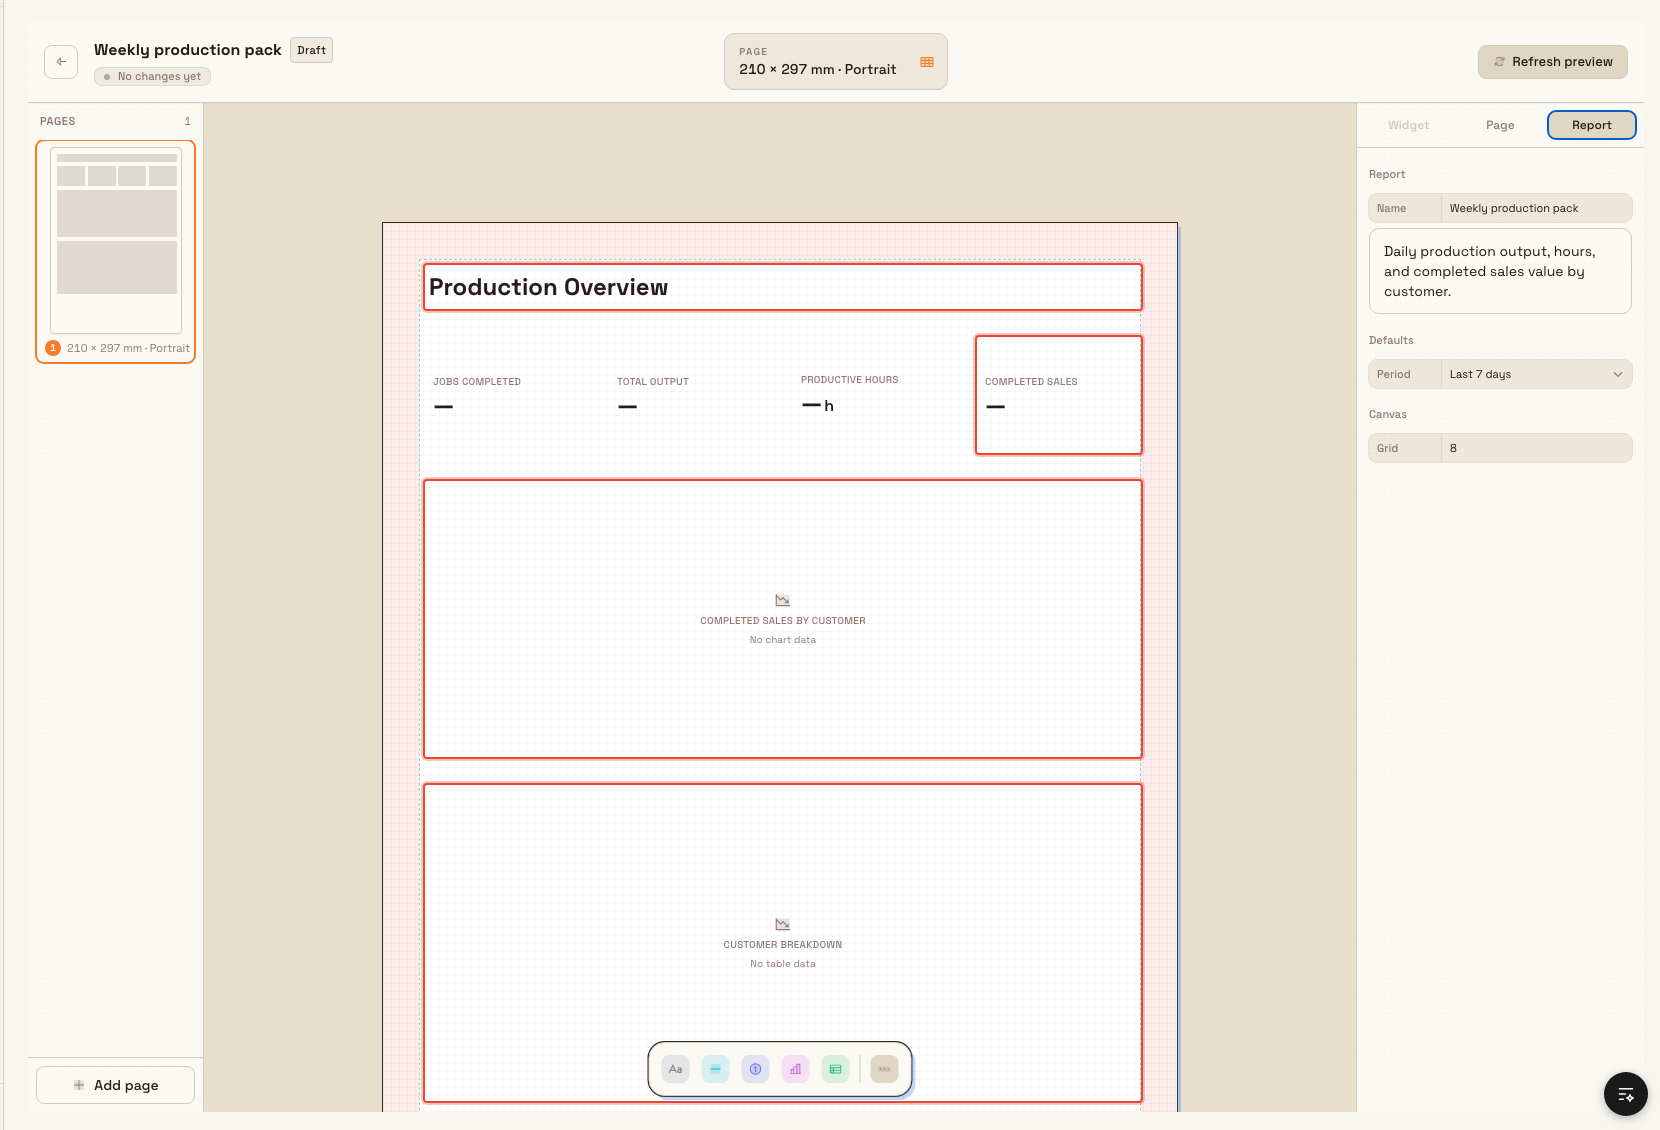
Publish, generate, and schedule
Card menu actions:
| Action | When it appears | What it does |
|---|---|---|
| Edit / Open | Always | Opens the editor (edit if draft and you can edit; otherwise open). |
| Preview | Always | Opens a preview of the layout. |
| Duplicate | Always | Copies the document; confirmation Report duplicated. |
| Publish | Draft (not archived) | Marks the layout published; confirmation Report published. Requires at least one widget. |
| Generate now | Published | Opens Generate report to build a one-off PDF. |
| Schedule | Published | Prepares a linked delivery definition, then opens Schedule Report. |
| Unpublish | Published | Returns to draft; confirmation Report unpublished. |
| Delete | When allowed | Soft-deletes the layout; dialog Delete report with “This cannot be undone.” Confirmation Report deleted. Delete is blocked while the report is Published. |
Generate a PDF once
- On a Published card, choose Generate now.
- In Generate report, choose a Reporting period: Yesterday, Today, This week, Last week, This month, Last month, Last 7 days, Last 30 days, This year, or Last 12 months.
- Select Generate PDF. A loading toast reads “Generating report…” / “You can keep working while the PDF is prepared.” The PDF downloads when the run completes. Generation uses the data scope saved in the layout and does not send email.
When the layout comes from the Individual Performance Feedback or Performance Report sample, Generate report also asks for Included employees. That list is the same people you can pick on a schedule. When the layout comes from the Operator Shift Review sample, it asks for Included operators. Leave it empty to include every operator who started a timer in the period, up to 50. When the layout comes from the Actions overview sample, it asks for Included projects. Leave projects empty to include every project at this site.
Generate a PDF from a Workflow
Workflow administrators can add the Generate PDF Action when a report should run as part of an automation. Choose one saved Report definition and, if needed, override its saved time period. Custom report layouts must be published before the Workflow can use them.
Preview checks the Report, its scope, the Workflow actor's reports.run permission, and the selected site's access without creating a Report run or file. A live run uses the same Reports queue and renderer as Generate now, so it appears in Report history and follows the standard Report process. Retrying the same Workflow step returns the same result instead of queuing a duplicate Report run.
Schedule recurring email
From a published card’s Schedule, or from the Schedules tab with New schedule / Create schedule:
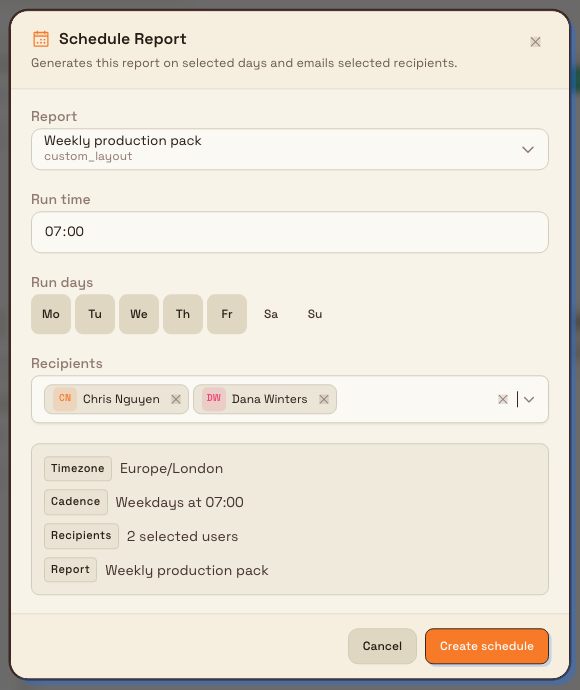
- The Schedule Report dialog describes: “Generates this report on selected days and emails selected recipients.”
- Choose the Report (pre-selected when you start from a card).
- Set Run time (default
07:00) and Run days (Mo to Su toggles; default all days → Daily at …). - Set Included employees, or leave it empty. For Employee feedback, this chooses whose performance pages are in the PDF.
- Select Recipients (at least one user). The summary shows Timezone (the site’s timezone), Cadence, an Employees count (or All employees when the field is empty), the recipient count, and the report name.
- Select Create schedule (or Save schedule when editing). Confirmation: Schedule created / Schedule updated.
Included employees lists each active user assigned to this site and each linked workforce employee at this site, including an employee whose sign-in is suspended. A workforce employee is shown with an employee code. The list leaves out people at another site, system accounts, deleted users, and an inactive site user who is not an active employee. For Employee feedback, an empty field includes every workforce employee at this site who is linked to a user. A person you pick is included only when they have a workforce record there.
Cadence labels also include Weekdays at …, Weekends at …, or named days (for example Mon, Wed, Fri at 07:00).
On the Schedules list you can:
- Toggle the switch to pause or resume (Schedule paused / Schedule resumed).
- Edit schedule, Run & download (immediate run with auto PDF download), View history (jumps to the History tab filtered to that schedule), or Delete schedule (dialog warns that future runs will stop; confirmation Schedule deleted).
Set up a monthly site performance summary
The Site performance summary sample answers one question for a plant manager: is this site getting better? It follows four measures month by month, compares each with the site's usual level, and puts them on one overall score. It is the same layout as the monthly performance summaries Bulk has written by hand for customer sites, rebuilt so every figure and sentence comes from your own data.
What the report shows
| Page | Content |
|---|---|
| 1 | A headline for the latest full month (for example "September at North was 6% below usual"), the overall score by month with the usual level of 100 dashed, the trend, four cards for the latest month against usual, and a like-for-like operator check. |
| 2 | One chart per measure: output per hour, average stop, right first time, and utilisation, each with its usual level dashed. |
| 3 | The monthly figures table and What stands out: the output per hour range, the like-for-like check, the stop reason's share of downtime, re-shots, utilisation, and any shift in work mix. |
| 4 | The hours logged each month, split into timer (running) time and OEE (downtime) time, then downtime hours by reason, stacked month by month, and the downtime table for the latest month. The five reasons with the most hours over the period get their own colour and the rest are grouped as Other reasons. |
| 5 | The work mix: each production mode's share of output, stacked month by month, with the five biggest modes shown and the rest grouped as Other work. Below it, the same modes' share of the timer and OEE hours logged that month, in the same colours. Each session's time goes to the modes recorded against it, else to the station's recorded mix that month, else to the modes its step allows. Time no shown mode accounts for is grey. Then how the figures are worked out. |
How the figures are worked out
The measures use the same rules as the site averages in the Individual Performance Feedback report, except that work recorded by Bulk staff is left out. When the report leaves it out, the method on the last page says so.
| Measure | Rule |
|---|---|
| Output | Everything recorded at the site in one unit, excluding inspections and work by Bulk staff. |
| Hours | Each operator's timer time plus logged downtime, with overlapping time counted once. |
| Output per hour | Output divided by hours. |
| Right first time | Output divided by output plus re-shots. |
| Utilisation | Running (timer) time divided by all logged hours. |
| Average stop | Hours of one downtime reason divided by the number of those stops, in minutes. By default this is the reason with the most downtime hours in the period, such as setting up the next job. |
| Usual | The average of each measure over the full months before the latest full month. |
| Overall score | Each measure divided by its usual level, with average stop turned round so shorter counts as better, then averaged and multiplied by 100. 100 is a usual month. A measure missing from any full month, such as utilisation when it was not logged, is left out of every month's score, and the note under the chart says so. |
| Trend | A straight line through the overall scores of the full months, in points a month. |
| Like for like | Operators who logged 20 or more hours in both the latest full month and the calendar month before it, and their combined output per hour in each. If the site was idle that month, the report says no operator qualified. |
A month the period only partly covers, such as the current month under This year, is marked with * and left out of the usual level and the latest month.
If the site recorded its first output inside the period, the months before it are left out. When that first output came after the 1st, its month counts from that day, is marked with *, has no overall score, and is left out of the usual level, so a short first month does not pull usual down. A site that has not recorded any output yet shows "No production was recorded" even if it logged hours.
Steps
- Open Settings, expand Data, and select Reports.
- Select Template library, open Site performance summary, and check the sample pages.
- Select Use template. Bulk creates a draft named Site performance summary with the default period Last 12 months and opens the editor.
- On the Report inspector tab, rename the report if you want (for example
North performance summary). - Under Performance calculations, check the measure settings:
- Stop reason: leave Biggest downtime reason, or pick the downtime reason your site tracks, such as setup between jobs.
- Unit: leave Unit with the most output, or pick the unit you count output in when the site records more than one.
- Output, Quality, and Hours filters work as in the feedback report. Use them to leave out production items, modes, resources, or downtime reasons that should not count.
- Select Refresh preview and read the headline, cards, and tables against what you know about the site.
- Select Publish.
- To send it, right-click the published card and choose Schedule. Pick one run day, for example Monday, and the recipients. With Last 12 months, each run covers the twelve full months before the run date, so the summary changes once a month, when a new month completes.
To change what the report says, edit the layout before you publish: move, remove, or restyle widgets, or bind extra widgets to the Site performance by month dataset. Headlines and notes use fields such as {{headline}}, {{cohort}}, and {{latest.output_per_hour_change}} in text widgets.
Choose the period with your history in mind
The usual level needs at least one full month before the latest full month. A site that started using Bulk recently has few full months, so its usual level rests on little history. Generate the report once the site has a few full months.
What the report does not do
- It does not explain why a measure moved. What stands out lists facts from the data, such as a change in work mix or the biggest downtime reason. Downtime and re-shot reasons are the ones operators chose in Bulk.
- It does not change who receives the weekly Individual Performance Feedback report. Use that report when each operator should see their own figures.
- Schedules run on days of the week. There is no monthly cadence yet, so a weekly run repeats the same months until the next month completes.
History and downloads
Open the History tab to audit every run. For a completed run with a PDF:
- Use the download control to open the PDF.
- Use the eye control to open Report Run Details (status, report date, type, triggered by, queue/start/complete times, recipient and email counts, file name/size, and any error message). Failed runs surface the error in the detail dialog.
Scheduled runs are created by the background scheduler; Run & download and Generate now create manual runs. Email delivery applies to scheduled runs with recipients; one-off generate from a definition is download-only.
Example: weekly review at Wayne Enterprises
Bruce Wayne opens Settings → Data → Reports at Gotham Applied Sciences. From Template library, he uses Actions overview to create an independent draft named Gotham weekly actions. He sets Last 7 days and selects Refresh preview. The canvas resolves the site's action totals and named projects, so he can check the layout with useful current data.
After the draft saves, Bruce selects Publish. He right-clicks its published card and chooses Schedule, fills 07:00, Monday through Friday, and two existing synthetic recipients. The screenshot shows that completed form. He selects Cancel, and Schedules still shows No schedules configured. Creating a real delivery would require saving that form; this capture did not send email.
Expected result
- Draft layouts appear on the Reports tab with a Draft badge and stay editable until published.
- Published layouts show Published, support Generate now and Schedule, and open read-only in the editor until you unpublish.
- Active schedules run on the chosen days at the site timezone and email selected users; you can pause them without deleting.
- History shows each run’s status and lets you download completed PDFs.
Feature state and limits
Configuring reports is generally available. Keep these behaviors in mind:
- Layouts, schedules, and history are per site; they are not shared across sites.
- Publish requires at least one widget; empty layouts cannot be published.
- You cannot edit a published layout until you Unpublish to edit (which also pauses linked active schedules).
- Delete is not offered for published reports; unpublish or leave them archived first as applicable.
- One-off Generate PDF does not email recipients; use a schedule for delivery.
- Data widgets depend on analytics and operational data for the selected period and scope; empty source data yields empty or low metrics in the PDF.
- A scheduled report still generates when the analytics data it reads is up to an hour behind. If that snapshot is more than an hour behind, the run fails. Check History and Report Run Details for the error.
- Actions overview includes at most 50 projects. If you leave Included projects empty on a larger site, the run asks you to select specific projects.
- Built-in PDF report types (OEE asset/user, production overview, 5S area, quality overview, pre-use checks, employee feedback, site performance by month, zero harm usage, and custom layout) power generation under the hood. Actions overview is a report-builder dataset on a custom layout, not a separate built-in type. Day-to-day configuration on this page is the report builder plus schedules and history. An older free-standing “report definition” form remains in the product code but is not the primary create path on this settings page.
Troubleshooting
- “Cannot publish a report with no widgets”: add at least one widget to a page, then publish again.
- “Cannot edit a published report. Unpublish it first.”: choose Unpublish on the card or Unpublish to edit in the editor, change the layout, then publish again.
- Generate now / Schedule missing on the card: the layout is still a draft (or archived). Publish a draft with widgets first.
- “Please select at least one recipient” / create disabled: the schedule form requires one or more recipients before Create schedule.
- “Please select a report”: on New schedule from the Schedules tab, pick a report that already has a delivery definition (usually created when you schedule or generate from a published layout). Prefer Schedule on a published card so the report is pre-selected.
- PDF never downloads after Generate or Run & download: open History, check for Failed and the error in Report Run Details, then fix data scope, period, or permissions and retry.
- Schedule stopped after unpublishing: unpublish pauses linked active schedules. After you republish, turn the schedule Active switch back on if you still want delivery.
- New report or schedule actions fail: your role may be view-only. Ask an administrator for
report_templates.create/report_templates.updateandreports.manage(andreports.runfor manual runs).
Production overview money figures use payable job totals that include assigned order services.
Related
- Configure exports: download organization data extracts (separate from PDF report packs).
- Run data imports: bulk-load data into Bulk.
- Roles and permissions: grant report template and schedule permissions.
- Manage PDF templates: job document / printout templates (different from analytics report packs).
- Review KPI detail and reports: KPI-side reporting in Insights.
Configure exports
Build reusable data exports from production, inbound, KPI, and settings tables; save templates, run downloads, schedule email delivery, and track history.
Run data imports
Create customers, parts, jobs, tasks, and other site records from CSV or Excel files with a guided six-step import wizard.