Analytics
Find and choose between the Analytics views — OEE Timeline, Asset Board, 5S Dashboard, and Asset Revenue — understand what each one shows, and see who can open it.
Analytics is the group of shop-floor reporting views in Bulk. Each view turns the records your plant already generates — production timers, downtime events, workplace audits, and recorded output — into a visual report that answers one question about how your equipment, people, and workplace are performing. Rather than one combined screen, Analytics is a set of focused views, each with its own purpose and its own in-depth guide.
Use Analytics when you want to step back from day-to-day operating and look at how a plant is doing: which machines are running now, where a shift lost time and why, how tidy and organised each area is, and which assets are earning the most. This page explains what each view covers, points you to the article that walks through it, and tells you who can open it. For the step-by-step detail of any single view, follow its link.
Where to find the Analytics views
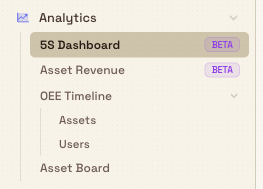
Open the Analytics group in the left sidebar. It carries a bar-chart icon and expands to show its views. There is no single "Analytics" page; you pick a view from the group and Bulk opens that view directly.
The group contains, in order:
- 5S Dashboard — labelled Beta.
- Asset Revenue — labelled Beta.
- OEE Timeline, which expands to two views: Assets and Users.
- Asset Board.
analytics.overview-01
The views at a glance
| View | Opens at | What it answers | Availability |
|---|---|---|---|
| OEE Timeline | Analytics, then OEE Timeline, then Assets or Users | How each asset or operator spent its time, and why | Available |
| Asset Board | Analytics, then Asset Board | What is happening on the floor right now | Available |
| 5S Dashboard | Analytics, then 5S Dashboard | How organised and orderly each area is | Beta |
| Asset Revenue | Analytics, then Asset Revenue | Which assets are earning the most value | Beta |
OEE Timeline
The OEE Timeline lays out how your equipment and people spent their time as a horizontal, Gantt-style band per asset or per operator. OEE stands for Overall Equipment Effectiveness, a standard manufacturing measure that combines how much of the available time a machine was producing, how fast it ran versus its expected rate, and how much of the output was good. The Assets view puts one row per machine; the Users view puts one row per operator. You can read the story behind a headline percentage, and correct a mislabelled or overrun record within a rolling recent window so every OEE report agrees.
Learn more: Review OEE timelines.
Asset Board
The Asset Board is a full-screen, live view of every asset on a production board for one site. An asset is a machine or workstation on the shop floor, such as a press brake or a laser cutter. The board shows, at a glance, which assets are running, which are paused or stopped, and how much each has produced today. It runs without the app sidebar and refreshes on its own, so it reads well on a wall-mounted display above the floor.
Learn more: Use the asset board.
5S Dashboard
The 5S Dashboard rolls up your 5S audit results into scores and trends. 5S is a lean method for keeping a workplace organised, named for its five steps: Sort, Set in Order, Shine, Standardize, and Sustain. The dashboard breaks scores down by pillar, shows per-area and per-asset performance you can drill into, and lets you set the date range and grouping. It is labelled Beta in the sidebar, so its layout and figures are still being refined.
Learn more: Review 5S analytics.
Asset Revenue
Asset Revenue attributes value to each asset over a period, so you can see which machines earn the most. You can group the figures By asset or By asset type, choose Month or Day granularity, and pick Last 3 months or a Custom range. The view ranks assets in a leaderboard, plots a trend, and shows how concentrated the value is across your fleet. Like the 5S Dashboard, it is labelled Beta, so treat its figures as an early view that may still change.
Learn more: Review asset revenue.
Who can open each view
Each view checks a permission when it loads its data. If your role does not include that permission, the view cannot show its data even though its entry still appears in the sidebar.
| View | Permission needed |
|---|---|
| OEE Timeline (Assets and Users) | View OEE (analytics.view_oee) |
| Asset Board | View OEE (analytics.view_oee) |
| 5S Dashboard | View audits (audits.view) |
| Asset Revenue | View production (production.view) |
In a standard Bulk role setup:
- View OEE is granted to the Super user, Entity admin, Manager, and Dashboards roles.
- View audits is granted to the Super user, Entity admin, Operator, Manager, Tablet user, and Invoicing roles.
- View production is granted to those same roles plus the Dashboards and Master data roles.
A role holds a permission if any role assigned to you grants it, so people with more than one role see the combined set of views. If a view will not load for you, an administrator can grant a role that includes the matching permission under Settings, then Organization, then User roles.
Permission is checked on the data, not the menu
The Analytics entries in the sidebar are the same for everyone. The access check happens when a view loads its figures, so a view can appear in your menu yet decline to show data until your role includes the permission listed above.
Example: a Monday review at Leeds Fabrication Plant
Dana Winters runs the Leeds Fabrication Plant for Granite Peak Manufacturing, a fictional fabricator used throughout these guides. On Monday morning she works through the Analytics views in turn.
She starts with the Asset Board on the wall screen to read the floor as it stands: five of eight bays running, one press brake paused for a material changeover, one weld bay stopped. Nothing there needs her, so she moves on.
Next she opens the OEE Timeline on the Assets view for the weekend shifts. One press brake sat lower than expected, and the timeline shows a long stop logged as "Awaiting material" that she knows was really a tooling changeover. She corrects the record there so every OEE figure matches what happened.
She then checks the 5S Dashboard for the past week to confirm the fabrication bays are holding their housekeeping scores, and finishes with Asset Revenue grouped By asset over the Last 3 months to see which machines carried the most value. In a few minutes, across four focused views, she has read the plant from four angles without opening a single order.
What you can expect
From this page you can identify the right Analytics view for the question you have, open it from the sidebar, and know in advance whether your role can see its data. Each view then covers its own controls, reading, and any corrections in its dedicated guide, linked above and under Related.
Availability and feature state
- The Analytics area is available, and the OEE Timeline and Asset Board views are generally available.
- The 5S Dashboard and Asset Revenue views are labelled Beta in the sidebar. Beta means they are usable but still being refined: their layout, controls, and figures may change, so treat their numbers as an early view rather than a settled report.
- Analytics is a set of reporting views. Creating and configuring what they draw on — asset boards, OEE dashboards, downtime reasons, and audits — happens in Settings, not on these pages.
- Large production reports use complete analytics snapshots instead of stopping after a fixed number of records. Snapshot-backed figures may take a few seconds to reflect the newest shop-floor change.
- Day-based availability, absence, and production groupings use each selected plant's local calendar day. Timestamped events keep their exact moment, so comparing plants does not rewrite their historical dates.
Troubleshooting
- A view appears in my menu but shows no data or an access error. Your role likely lacks the permission that view checks when it loads. Compare your roles against the permission table above, and ask an administrator to grant a role that includes it.
- A view looks empty even though I have access. The view has nothing to show yet. The OEE Timeline and Asset Board need a configured dashboard or board, and the 5S Dashboard needs completed 5S audits. Open the linked guide for that view to see what it depends on.
- The figures in a Beta view look off. The 5S Dashboard and Asset Revenue are Beta and still being tuned. Cross-check anything you plan to act on against the underlying records, and expect their presentation to keep changing.
Related
- Review OEE timelines — read and correct how each asset or operator spent its time.
- Use the asset board — the live, TV-ready view of one site's floor.
- Review 5S analytics — workplace-organisation scores and trends.
- Review asset revenue — which assets earn the most value.
- Dashboards — the wider set of OEE and production dashboards.
- KPIs — track targets that some Analytics views measure against.
Insights and visual management
Find your way around Bulk's reporting and visual-management tools — KPIs, dashboards, analytics reports, teamboards, boards, whiteboards, Atlas, and the Digital Twin — and open the right guide for each.
Review 5S analytics
Read the 5S Audits Overview dashboard to track workplace-organization scores, pillar performance, and area or asset breakdowns for one site.