Use the asset board
Open and read the asset board, a TV-ready live view of shop-floor asset status, output, and efficiency for one site.
The asset board is a full-screen, live view of every asset on a production board for one site. In Bulk, an asset is a machine or workstation on the shop floor, such as a press brake or a laser cutter, and a site is one plant or location. The board shows, at a glance, which assets are running, which are paused or stopped, and how much each has produced today, so a supervisor or a wall-mounted display can read the state of the floor without opening any records.
The board is designed to be left open on a screen. It runs without the app sidebar and refreshes on its own as operators start, pause, and stop work.
When to use the asset board
Use the asset board when you want a shared, always-on picture of live production for a single site. Common uses:
- Mount it on a screen above the shop floor so operators and supervisors see current status.
- Keep it open on a monitor at a team lead's desk during a shift.
- Glance at how many assets are running right now, and which ones are stopped and why.
- Track how the day's output is tracking against target.
For a per-asset history over time, or a breakdown of stop reasons, use the OEE timeline and OEE dashboards instead. The asset board answers "what is happening now," not "what happened last week."
Before you start
You need the following to view a useful board:
- The View OEE analytics permission (
analytics.view_oee). This permission loads the board's data. It is granted by the Super user, Entity admin, Manager, and Dashboards roles by default. OEE stands for Overall Equipment Effectiveness, the standard measure of how well equipment is used. - At least one asset board configured for the site, with one or more assets added to it. If no board or no assets exist yet, the page shows an empty state instead of cards.
- A site (entity) selected in Bulk. The board always reflects one site at a time.
Creating a board, choosing which assets it shows, and setting its daily reset time are done in settings, not on this page. See Configure the asset board for those steps.
Viewing versus configuring
This page covers reading a board that already exists. Creating boards, adding assets, choosing a default board, and linking an output target all happen in Settings, under OEE. This page is read-only.
Open the asset board
- Open the Analytics menu.
- Select Asset Board. The board opens at
/analytics/assets-board.
The board loads the site's default board first. It fills the whole screen and hides the sidebar so it reads well on a wall display. If the site has more than one board, a board picker appears in the header, described below.
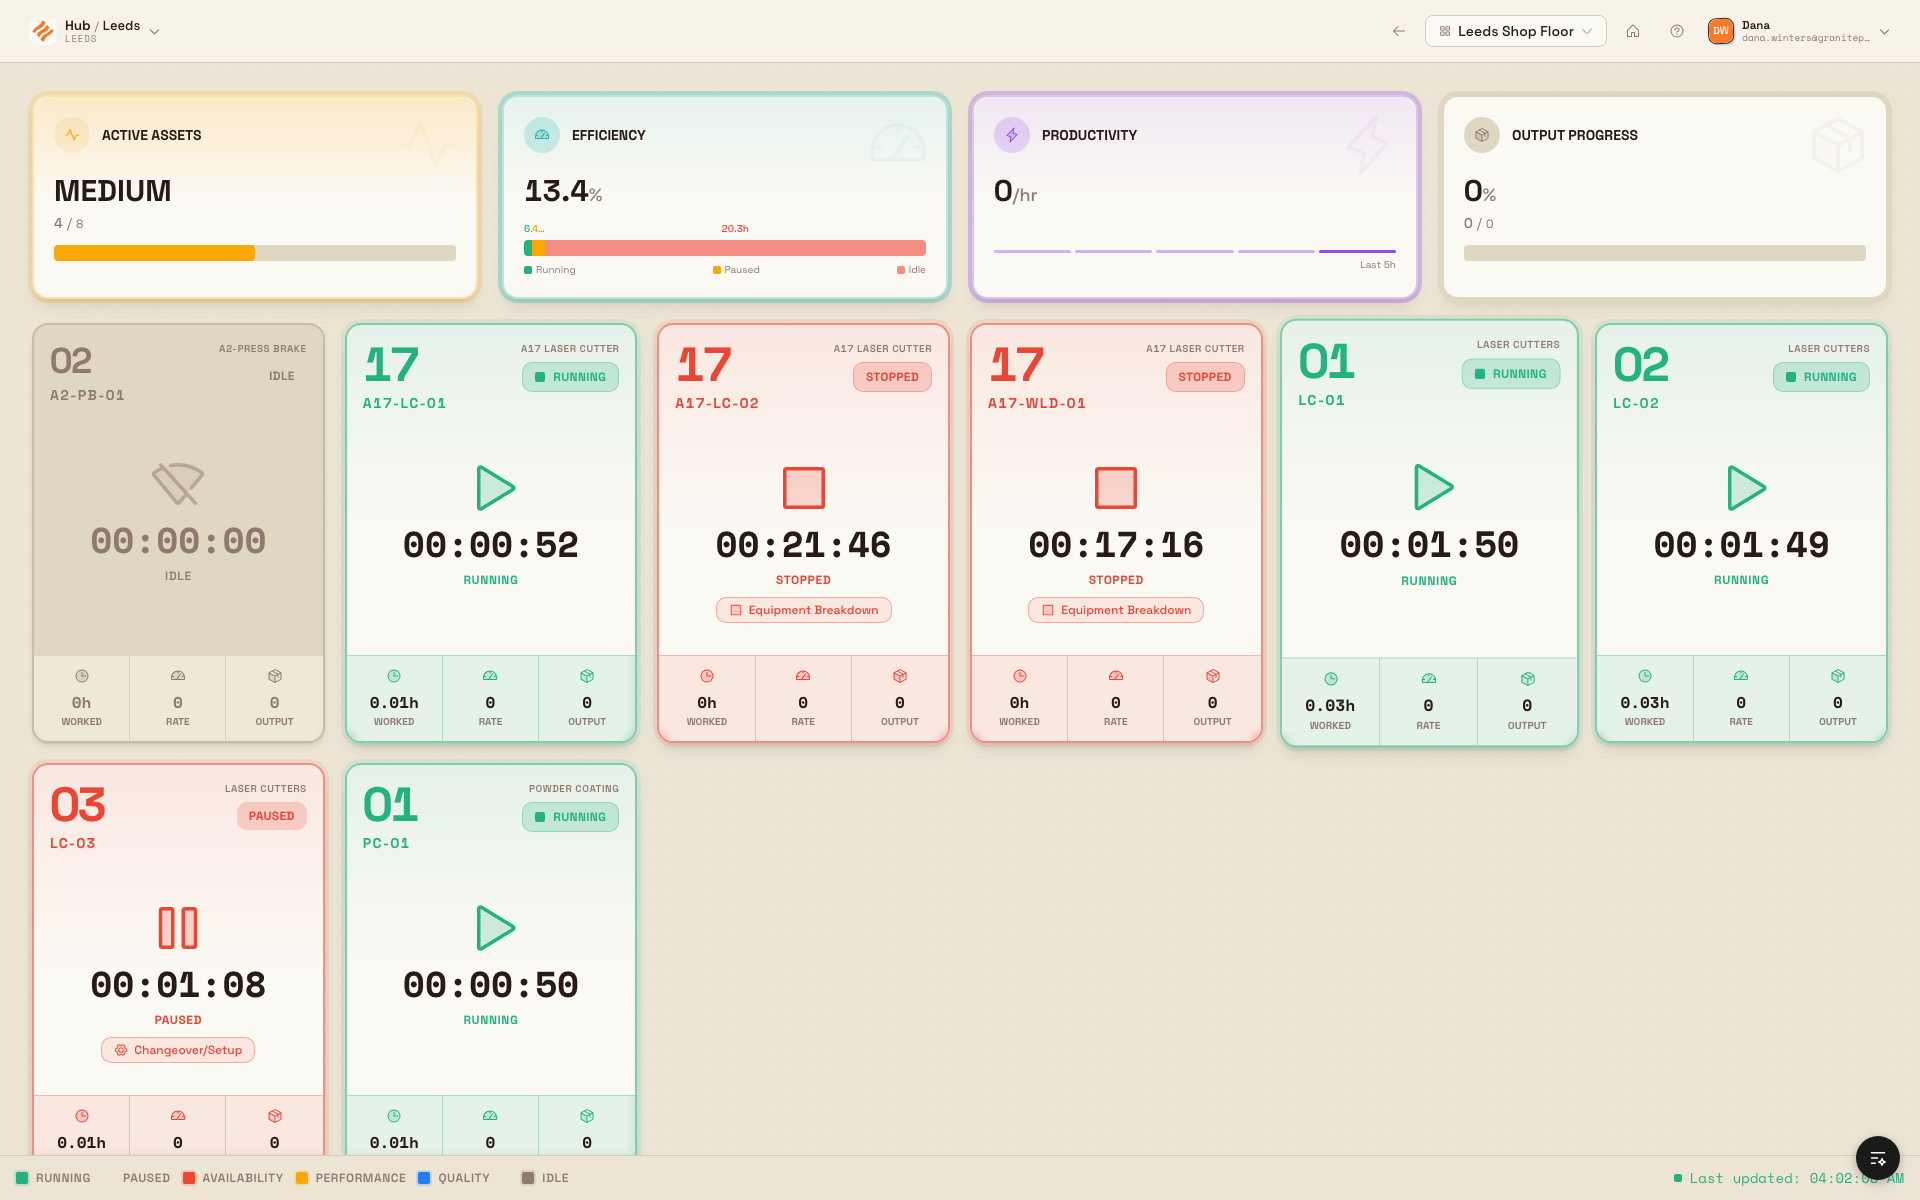
analytics.asset-board-01
Read the summary tiles
A row of four tiles across the top of the board summarises the whole board for the current production day:
- Active assets shows a level of
HIGH,MEDIUM,LOW, orN/A, plus the count of assets currently running out of the total on the board. It answers "how much of the floor is working right now." - Efficiency shows recorded-time efficiency for the day: running time divided by running plus paused time, as a percentage. A small bar underneath splits the day's hours into running, paused, and idle so you can see where time went.
- Productivity shows the most recent hourly output rate, per hour, with a short trend of the last five hours (labelled
Last 5h). It rises and falls as output is recorded. - Output progress shows today's total output against the day's target as a percentage, with the current and target figures beneath. This tile stays at zero until the board is linked to a daily output target.
The tiles use colour to signal health: green for good, amber for warning, red for low, and neutral grey when there is nothing to measure yet.
Read the asset cards
Below the tiles, the board shows one card per asset, sized to fit the screen and the number of assets. On large displays the grid scales up so a wall screen stays readable.
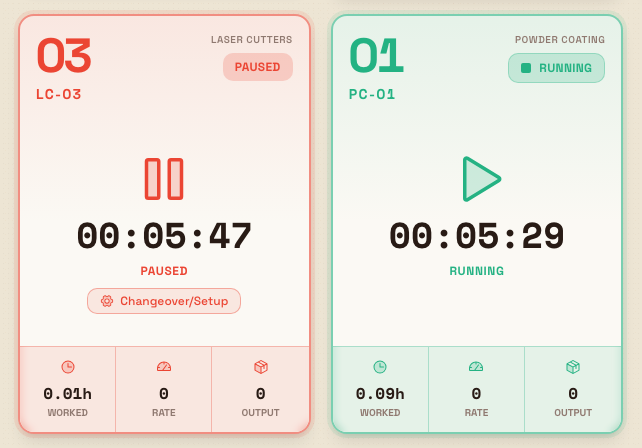
Each card shows:
- A bay number taken from the asset's code, the full asset code, and the asset type.
- A status badge and a large status icon.
- A live timer counting how long the asset has been in its current state, with the state name beneath it (Running, Paused, Stopped, or Idle). The timer updates every second.
- On paused or stopped cards, a downtime reason chip naming why the asset is not running, for example "Material changeover."
- A footer with three figures for the day: Worked (hours the timer has run), Rate (current output rate), and Output (units produced).
The card's colour and status come from live shop-floor activity:
- Running (green): a production timer is actively counting at the asset.
- Paused (amber): work is paused against a downtime reason recorded by a timer or a sensor.
- Stopped (red): work is stopped against a downtime reason a person entered by hand.
- Idle (grey): no timer is running at the asset.
analytics.asset-board-02
Understand the status legend
A legend is fixed to the bottom of the board so anyone reading the screen can decode the colours. It shows swatches for Running, Paused, and Idle. The paused swatches are split by OEE category, so a stop's colour tells you what kind of loss it is:
- Availability losses (the equipment was not available to run).
- Performance losses (it ran slower than it should).
- Quality losses (output had to be scrapped or reworked).
A paused or stopped card takes its accent colour from the category of its downtime reason, which is why setting a category on each reason keeps the board readable. The legend also shows a Last updated time with a small live indicator that signals when the board last refreshed.
Switch between boards
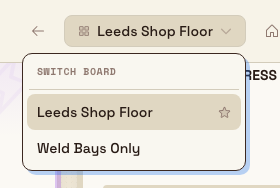
A site can have more than one board, for example one per production line or shift. When two or more boards exist, a board picker appears in the header:
- Open the board picker in the header (the control shows the current board's name).
- Choose another board from the list. The default board is marked with a star.
Switching boards adds the chosen board's ID to the page address as a board query parameter, so you can bookmark a specific board or pair a display to it. If the site has only one board, the picker does not appear and that board loads automatically.
analytics.asset-board-03
How the board stays live
The board keeps itself current without a manual refresh:
- It updates within seconds when operators start, pause, or stop timers, or record output, because it listens for those changes.
- It refreshes on its own roughly every half a minute while the tab is visible, so elapsed timers and time-based figures stay accurate.
- It refreshes immediately when you return to the tab or when the connection comes back after a drop.
Daily figures, such as worked hours, output, and efficiency, reset at the board's configured Day Reset Time in the site's time zone. For example, a reset time of 6 AM means the production day runs from 6 AM to 5:59 AM the next day.
Example: Leeds Fabrication Plant shop-floor board
Granite Peak Manufacturing runs the Leeds Fabrication Plant. The shift supervisor wants the team to see live status without asking around, so a monitor on the wall shows the Leeds Shop Floor board.
The board lists the plant's fabrication bays. Mid-morning, the supervisor glances up and reads the floor in a second:
- The Active assets tile reads
MEDIUM, 5 of 8 running. - Bays LC-01 and LC-02 (laser cutters) are green and Running, each with a live timer past two hours and a healthy output figure in the footer.
- Bay PB-03 (a press brake) is amber and Paused with the reason "Material changeover," an Availability-category stop, so the card is colour-coded accordingly.
- Bay WB-04 (a weld bay) is red and Stopped with the reason "Tooling fault," entered by the operator.
- Two bays are grey and Idle because no timer is running there.
- The Output progress tile shows 62% of the day's target because the board is linked to the plant's daily output KPI.
The supervisor sees the changeover on PB-03 is expected, but the "Tooling fault" stop on WB-04 needs attention, and walks over to help. No report needed, just a glance.
Expected result
You have a full-screen, self-updating view of one site's assets. Anyone looking at the screen can tell, without clicking, how much of the floor is running, which assets are stopped and why, and how the day's output is tracking against target.
Limitations and availability
- The asset board is generally available.
- The board is read-only. You view status here. Creating boards, adding or removing assets, choosing the default board, and setting the reset time are done in settings. See Configure the asset board.
- The board picker only appears with two or more boards. With a single board, that board loads automatically and no picker is shown.
- Output progress needs a linked target. The Output progress tile stays at zero until the board is linked to a daily output KPI and a target is set for the day. See Set KPI targets.
- Status comes from live production activity. An asset shows as Idle whenever no timer is running at it, even if it is physically working, because the board reads production timers and downtime events. Paused and stopped states, and their reasons, come from the downtime events operators record.
- The board reflects one site at a time. Switch the selected site to see a different plant.
Troubleshooting
- The board shows "No assets configured." The board you opened has no assets on it. Select Go to settings on that screen, or open Settings and then OEE and then Asset Board, and add assets to the board. See Configure the asset board.
- The board will not load or shows an error. Confirm your role has the View OEE analytics permission. Without it, the board cannot read its data.
- An asset you expect is missing. It is either not on this board's asset list or it is inactive. Edit the board to add it, or switch to a board that includes it.
- Every asset shows as Idle. No production timers are running for those assets. Live status comes from timers on the shop floor. See Run production timers.
- A card shows a stop but no reason name. The downtime event has no reason attached, or the reason has no category, so the card cannot colour-code it. See Configure downtime reasons.
Related guidance
- Configure the asset board — create boards, choose assets, set the reset time, and link an output target.
- Configure downtime reasons — set the reasons and OEE categories that colour paused and stopped cards.
- Run production timers — the shop-floor timers that drive live status.
- Record production output — how output feeds the board's figures.
- Set KPI targets — set the daily target behind the Output progress tile.
- Review OEE timelines — per-asset history when you need more than the live view.
- Analytics — the full set of analytics views.
Review OEE timelines
Read the OEE Timeline to see how each asset or operator spent its time, spot and categorise downtime, and correct mislabelled or overrun records within the last 48 hours.
KPIs
How KPIs in Bulk turn shop-floor data into tracked performance measures, and where to find the guides for categories, KPIs, targets, reports, and AI assistance.