Review 5S analytics
Read the 5S Audits Overview dashboard to track workplace-organization scores, pillar performance, and area or asset breakdowns for one site.
The 5S Audits Overview is a read-only dashboard that summarizes how your site is performing against 5S, a lean method for keeping a workplace organized, clean, and standardized. 5S takes its name from five steps, called pillars: Sort (Seiri), Set in Order (Seiton), Shine (Seiso), Standardize (Seiketsu), and Sustain (Shitsuke). In Bulk, teams run 5S audits — scored checklists carried out against a defined area of the shop floor (for example a bay or a store) or against a specific asset (a machine or workstation). This dashboard rolls those completed audits up into scores, trends, and breakdowns so you can see, at a glance, where the site stands and which areas need attention.
The page does not create or edit audits. It reads audits that people have already completed and turns them into metrics. Running a 5S audit happens elsewhere; this page is where you review the results.
When to use the 5S dashboard
Use the 5S Audits Overview when you want a single, period-based picture of workplace organization across a site. Common uses:
- Check the site's overall 5S score for the last week, month, or quarter, and whether it is trending up or down.
- See which of the five pillars is dragging the score down, so improvement effort goes where it counts.
- Compare areas (or audited assets) against each other and spot the ones with low scores or open issues.
- Confirm that scheduled 5S audits are actually being completed on time.
For the step-by-step of carrying out an audit, see Run a 5S audit. This dashboard answers "how are we doing overall," not "how do I record one audit."
Before you start
You need the following to see a useful dashboard:
- The View audits permission (
audits.view). This permission loads every figure on the page. It is granted by default to the Super user, Entity admin, Manager, Operator, Tablet user, and Invoicing roles. Without it, the page cannot read its data. - A site (called an entity in Bulk) selected. The dashboard always reflects one site at a time.
- At least one completed 5S audit in the selected period. Scores, charts, and breakdowns are built from completed audits only. If none exist for the period, the page shows an empty state instead of data.
Setting up 5S audits — creating audit areas, building the checklist template, and scheduling recurring audits — is done in Settings, not on this page. Those steps are what populate the dashboard. See the related guidance at the end of this article.
Reviewing versus running audits
This page is read-only. It shows results from audits that are already complete. Creating areas and templates, scheduling audits, and carrying out an audit all happen elsewhere. Nothing on this page changes an audit or its score.
Open the 5S dashboard
- Open the Analytics menu in the sidebar.
- Select 5S Dashboard. The dashboard opens at
/analytics/five-s.
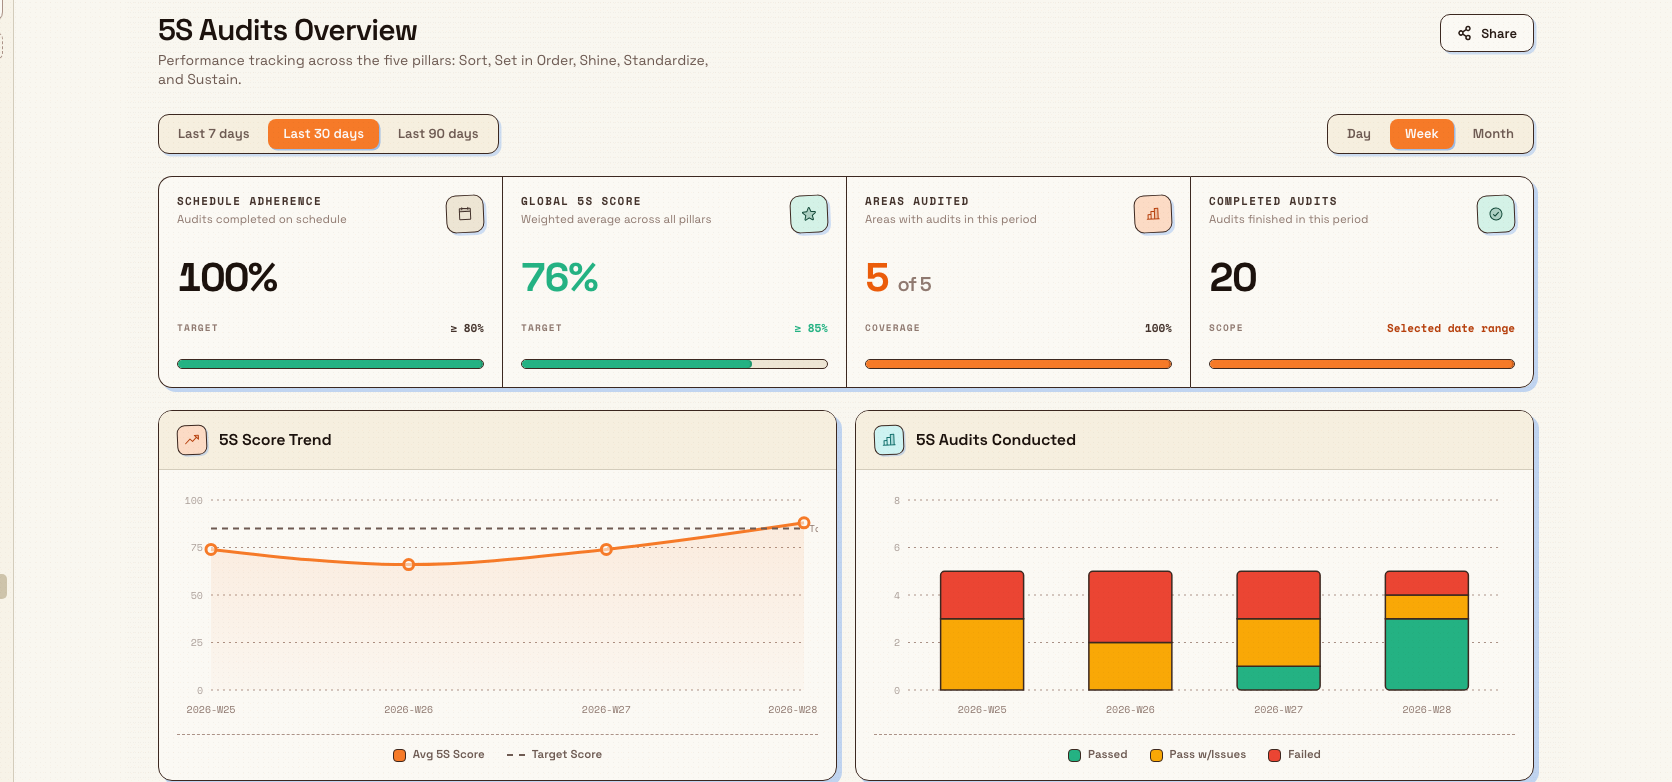
The page header reads 5S Audits Overview, with the subtitle "Performance tracking across the five pillars." The 5S Dashboard is currently marked Beta in the navigation menu (see feature state below).
analytics.5s-01
Set the period and granularity
A toolbar sits directly under the header. It controls the window every figure on the page is calculated over:
- Period (left): choose Last 7 days, Last 30 days, or Last 90 days. The page opens on Last 30 days.
- Granularity (right): choose Day, Week, or Month. This sets how the two charts group audits into time buckets. The page opens on Week.
Changing either control recalculates the summary metrics, the charts, the pillar breakdown, and the area or asset breakdown together, so the whole page always describes the same window.
Read the summary metrics
A row of four cards summarizes the selected period:
- Schedule Adherence — the share of scheduled 5S audits that were completed on time, against a target of "≥ 80%." If the site has no active 5S schedule, this card shows a dash and the note "No 5S schedule configured," because there is nothing to be adherent to.
- Global 5S Score — the weighted average score across all five pillars for the period, against a target score. The target comes from your published 5S checklist template, and defaults to 85% when none is set.
- Areas Audited — how many areas had at least one audit in the period, out of the total number of active areas, plus a Coverage percentage.
- Completed Audits — the count of 5S audits finished in the period, across both area-based and asset-based audits.
Each card carries a small progress bar so you can read its level without reading the number.
Track the score trend and audit volume
Two charts sit below the summary cards:
- 5S Score Trend — an area chart of the average 5S score over time, grouped by your chosen granularity. When a target score is set, a dashed Target line is drawn across the chart, and the legend shows Avg 5S Score and Target Score. Use it to see whether organization is improving or slipping.
- 5S Audits Conducted — a stacked bar chart of how many audits were completed in each time bucket, split by outcome: Passed, Pass w/Issues, and Failed. Hovering a bar shows each count and the bucket total. Use it to see audit volume and how many audits are turning up problems.
Review the pillar breakdown
The Breakdown by 5S Pillar section shows one card for each of the five pillars, in order: Sort, Set in Order, Shine, Standardize, and Sustain. Each card names the pillar and its Japanese term, shows the pillar's average score for the period, and indicates how many issues were found against it. A pillar with no data for the period reads as empty rather than zero.
This is the fastest way to see which discipline is weak. A site can hold a healthy overall score while one pillar — often Sustain, the habit of keeping the gains — quietly lags.

analytics.5s-02
Drill into areas and assets
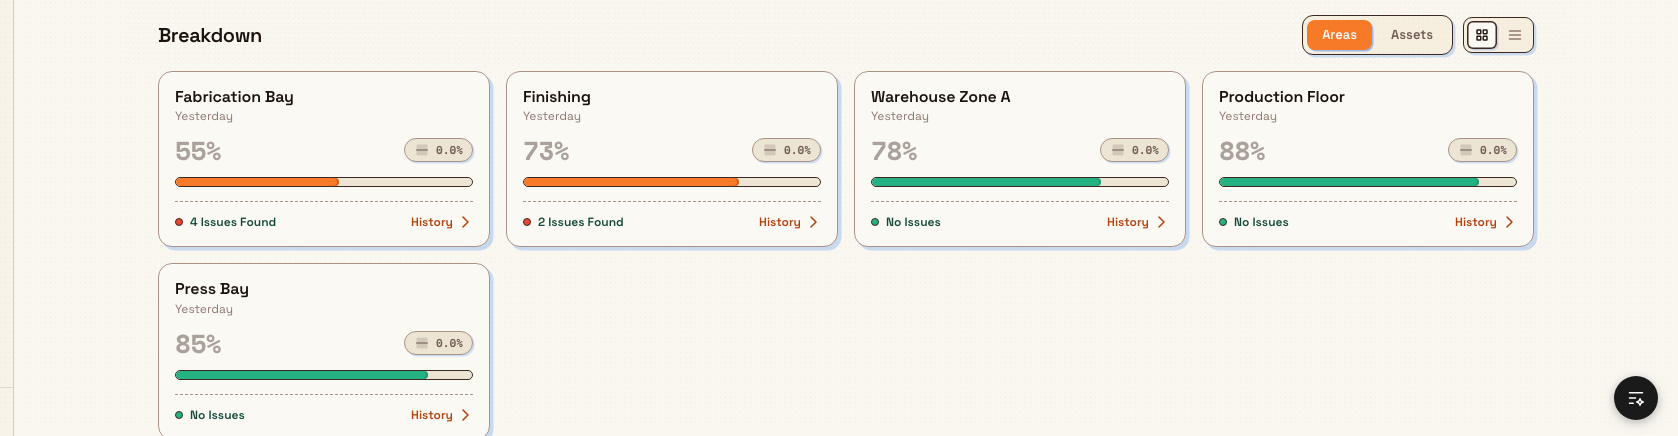
The final Breakdown section lists individual subjects and lets you open any one of them. Two controls sit in its header:
- A Areas / Assets toggle. Areas lists every active audit area. Assets lists only the assets that actually had a 5S audit in the period (equipment-level 5S checks), highest score first.
- A view switch between card view and list view. Card view shows a tile per subject; list view shows the same subjects as rows with columns for Status, 5S Score, Progress, Issues, and History.
Each area or asset shows:
- Its name and when it was last audited (or "No audits yet").
- Its average 5S score for the period, and a trend figure comparing it with the previous period (an up, down, or flat indicator).
- An issues indicator: the number of failed checklist items in that subject's most recent audit. "No Issues" shows when the latest audit had none.
Cards are color-coded by score band, from excellent down to critical, so weak subjects stand out. Selecting an area opens that area's 5S history; selecting an audited asset opens its most recent 5S audit result. If the period has no completed audits at all, this section shows "No 5S data available" instead of subjects.
analytics.5s-03
Share the view
The Share button in the header copies the current page link to your clipboard and confirms with "Link copied to clipboard." Paste it into a message or a board so a colleague opens the same dashboard. The link points to the 5S dashboard for the site you are in; it does not encode the period or breakdown options you have selected.
Example: Leeds Fabrication Plant weekly 5S review
Granite Peak Manufacturing runs weekly 5S audits at its Leeds Fabrication Plant. Its audit areas include the Press Brake Bay, the Laser Cutting Cell, the Welding Bay, the Goods-In Store, and the Finishing line. Every Monday, the continuous-improvement lead opens Analytics then 5S Dashboard to prepare for the shift huddle.
She leaves the period on Last 30 days and reads the top of the page:
- Schedule Adherence is 90% — nine of the ten scheduled audits were done on time, comfortably above the 80% target.
- Global 5S Score is 82%, just under the plant's 85% target, and the 5S Score Trend chart shows it drifting down over the last two weeks.
- Areas Audited reads 5 of 5, so coverage is complete.
The Breakdown by 5S Pillar cards make the cause obvious: Sort, Set in Order, and Shine all sit in the high 80s, but Sustain is at 71% and carries the most issues. In the Breakdown section she switches to list view and sees the Welding Bay area scoring 68% with a downward trend and four issues found in its latest audit. She selects the Welding Bay card to open its history, notes the recurring failed items, and brings that to the huddle as the week's focus. No spreadsheet, no manual tally — the dashboard did the aggregation.
Expected result
You have a period-scoped, read-only view of one site's 5S performance: a headline score against target, schedule adherence, audit volume and outcomes over time, a score for each of the five pillars, and a ranked breakdown of every area or audited asset with its score, trend, and open issues — with a drill-down into any subject that needs a closer look.
Limitations and feature state
- The 5S Dashboard is marked Beta. It carries a "Beta" badge in the Analytics menu. Treat its figures as usable for review, but expect the layout and metrics to keep evolving; this is not a general-availability guarantee.
- The page is read-only. You review results here. Creating areas and templates, scheduling audits, and carrying out an audit all happen elsewhere.
- Everything is built from completed 5S audits. In-progress or abandoned audits do not count. An area with no completed audit in the period reads as "No audits yet," and a period with none shows the empty state.
- The issue count reflects the latest audit only. A subject's Issues figure is the number of failed checklist items in its most recent completed audit, not a running total across the period.
- Schedule Adherence needs an active 5S schedule. With no active schedule, the card shows a dash and "No 5S schedule configured" rather than a percentage.
- The Assets breakdown lists only audited assets. Assets appear under the Assets dimension only if they had a 5S audit in the period; the full asset register is not shown here.
- The dashboard covers one site at a time. Switch the selected site to review a different plant.
- The period cannot exceed 365 days. The preset ranges are 7, 30, and 90 days.
Troubleshooting
- The page shows "No 5S data available." No 5S audits were completed for the selected period and dimension. Widen the period, switch the Areas/Assets toggle, or complete a 5S audit first. See Run a 5S audit.
- The page will not load or shows an error. Confirm your role has the View audits permission (
audits.view). Without it, the dashboard cannot read its data. - Schedule Adherence shows a dash. The site has no active 5S schedule, so there is nothing to measure adherence against. Set up a recurring 5S schedule to populate this metric. See Schedule audits.
- The Global 5S Score has no target line. No target score is set on your published 5S checklist template, so the chart draws no Target line and the summary card falls back to an 85% target. Set a target on the 5S template. See Build an audit template.
- An area you expect is missing from the breakdown. The area may be inactive, or it may have had no completed audit in the period. Check the area in Settings, or widen the period. See Set up audit areas.
Related guidance
- Run a 5S audit — carry out the audits that feed this dashboard.
- Set up audit areas — define the shop-floor areas that 5S audits score.
- Build an audit template — create the 5S checklist and set its target score.
- Schedule audits — set the recurring cadence behind Schedule Adherence.
- Analytics — the full set of analytics views for a site.
- Review OEE timelines — equipment-effectiveness analytics alongside 5S.
Analytics
Find and choose between the Analytics views — OEE Timeline, Asset Board, 5S Dashboard, and Asset Revenue — understand what each one shows, and see who can open it.
Review asset revenue
Read the Asset Revenue report to see how much sales value each machine or workstation earns, ranked by revenue and broken down by job and customer.