Dashboards
Open Bulk's built-in, always-live analytics dashboards for a site from the standalone Dashboards picker, and choose the right board by name, code, or live signal.
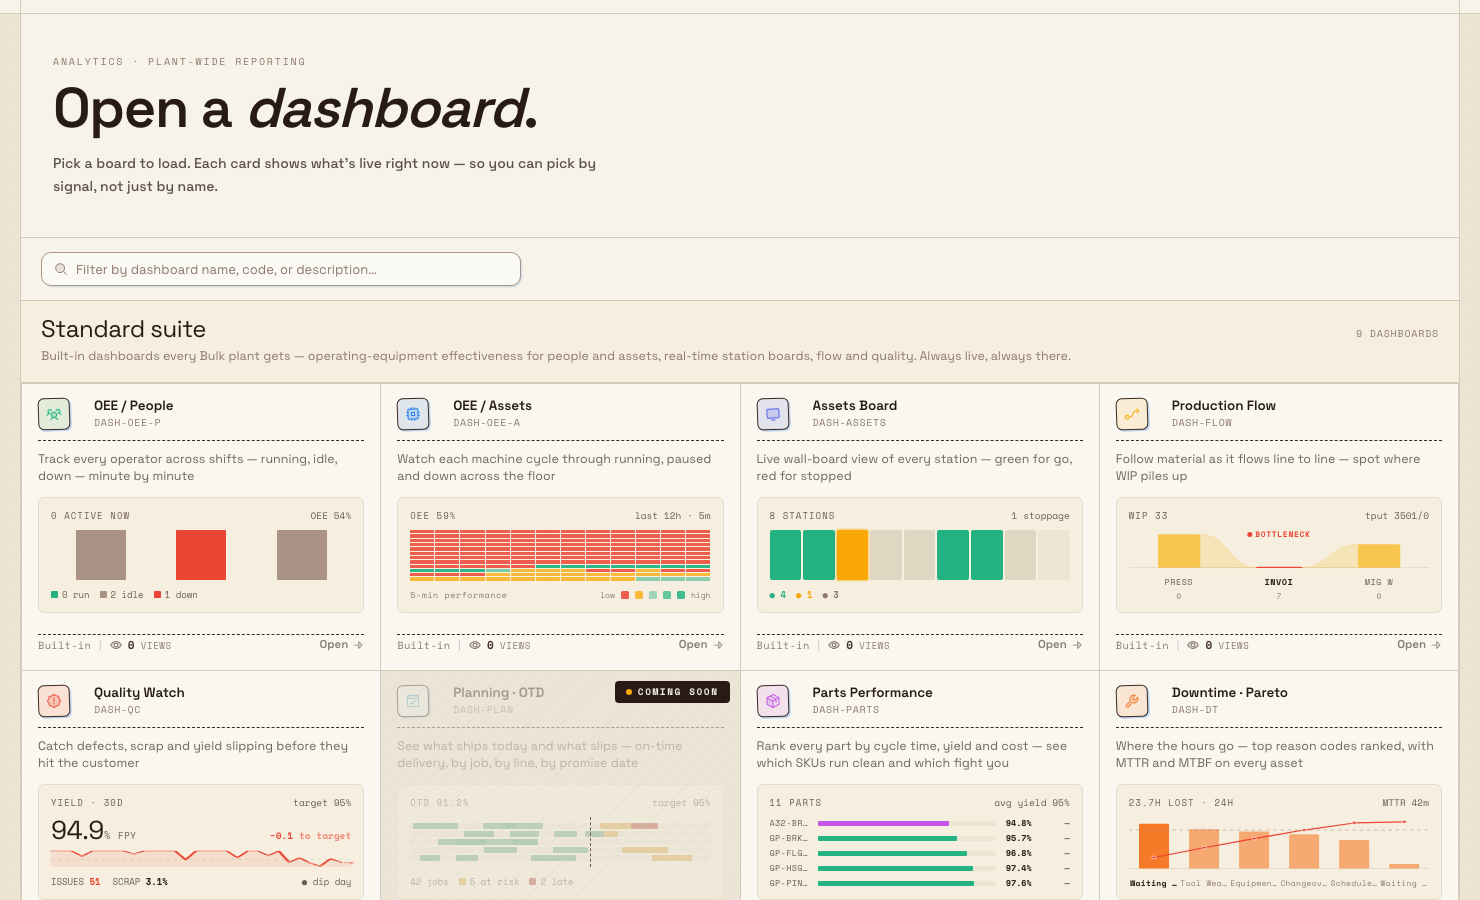
Dashboards is where you open Bulk's built-in analytics boards for one site. In Bulk, a dashboard is a full-screen, live view of what is happening on the floor right now — operator and machine effectiveness, station status, flow, quality, and downtime. The Dashboards module is a standalone picker at the /dashboards route: it fills the whole screen with no sidebar, and each card previews what is live before you commit to opening it.
OEE (Overall Equipment Effectiveness) is a standard manufacturing measure of how much good output a machine or operator produces versus its theoretical best. Several of the built-in boards report OEE, so you will see the term throughout this module.
Use Dashboards when you want to watch the plant rather than edit it — for a shift huddle, a wall display on the line, or a quick check of where hours or quality are slipping. To build your own board from individual widgets instead, use the separate Boards module.
dashboards.overview-01
When to use Dashboards
Open Dashboards when you need a ready-made, always-on view of a site's performance:
- Put a board on a wall display for a production line or a morning stand-up.
- Check operator and machine effectiveness across the current shift.
- Spot where work-in-progress, scrap, or downtime is building up before it reaches the customer.
- Jump straight to a specific board by name or code without navigating a menu tree.
Each of the built-in boards has its own reference article; this page explains the picker that ties them together and links out to each one.
Before you start
You can open the picker if you are signed in, have finished onboarding, and have a site (called an entity in Bulk — one physical plant or location) selected. No special permission is needed to reach the picker shell itself.
Each live preview uses the same permission as its full dashboard:
- OEE / People, OEE / Assets, and Assets Board require View OEE analytics (
analytics.view_oee). - Value Flow and Parts Performance require View production (
production.view). - Quality Watch requires View quality dashboard (
quality_dashboard.view). - Downtime · Pareto requires View production jobs (
production_jobs.view).
No live previews on the cards?
Each card checks only the permission listed above. Ask an administrator to grant the missing permission or add you to a role that already has it.
Open the Dashboards picker
Dashboards opens as its own full-screen page, separate from the main app chrome:
- From the Home screen, open the Dashboards module tile. The picker loads at
/dashboards. - The page opens with a header in standalone mode — the global search box and notifications are hidden so the boards have the full screen.
- You land on the picker headed Open a dashboard., with the prompt "Pick a board to load. Each card shows what's live right now — so you can pick by signal, not just by name."
When you are inside a board, a back control returns you to this picker so you can switch to another one.
The standard suite
The first section, Standard suite, holds the built-in dashboards that ship with every Bulk site. Seven of them are ready to open:
- OEE / People (
DASH-OEE-P) — every operator across shifts, minute by minute: running, idle, or down. See Review OEE people. - OEE / Assets (
DASH-OEE-A) — each machine cycling through running, paused, and down across the floor. See Review OEE assets. - Assets Board (
DASH-ASSETS) — a live wall-board view of every station, green for go and red for stopped. This one opens the Asset Board in Analytics. - Value Flow (
DASH-FLOW) — where value and work-in-progress sit across routings, steps, and machines, and what to chase next. See Review Value Flow. - Quality Watch (
DASH-QC) — defects, scrap, and first-pass yield, so slips surface before they reach the customer. See Use Quality Watch. - Parts Performance (
DASH-PARTS) — every part ranked by cycle time, yield, and cost, so you can see which run clean and which fight you. See Review parts performance. - Downtime · Pareto (
DASH-DT) — top reason codes ranked, with mean time to repair (MTTR) and mean time between failures (MTBF) per asset. See Review downtime Pareto.
Two more standard cards — Planning · OTD (DASH-PLAN) and Changeover · SMED (DASH-CO) — appear with a hatched overlay and a status pill that marks them as not yet available. You can see the layout that is planned, but you cannot open them yet.
Each available card shows a hue-tinted icon, the board's name and code, a short description, and a live preview of the board's key numbers. Cards load independently, so one slow or failed preview does not hold up the others. While a preview loads it shows a placeholder skeleton; if its data fails to load it shows an error block whose retry link reloads only that card. The card footer is labelled Built-in, and three cards — OEE / People, OEE / Assets, and Assets Board — also show a running count of how many times that board has been opened for the site.
Pick and open a board
The picker separates choosing a board from opening it, so a single stray click never yanks you off the page:
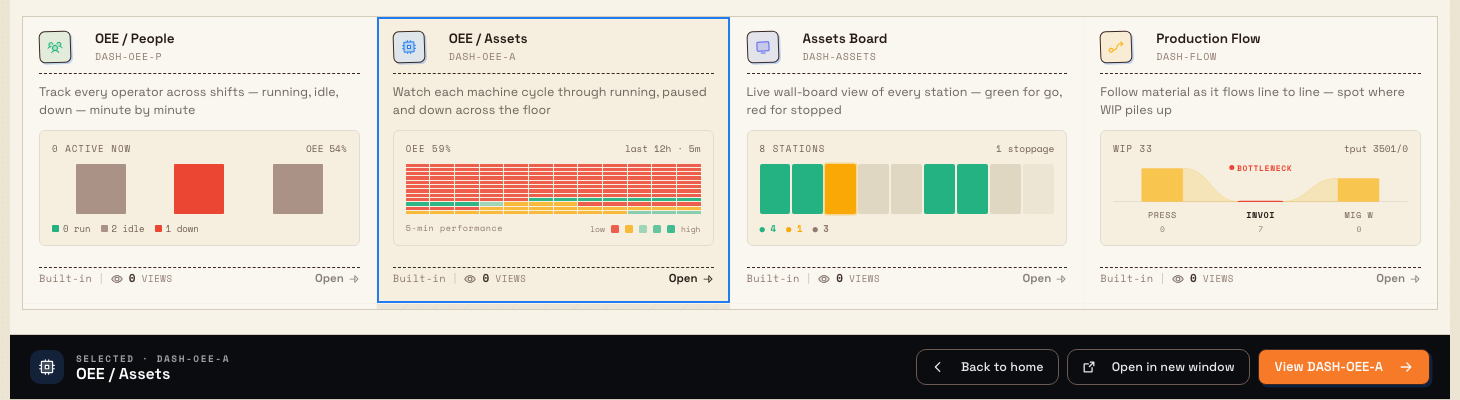
- Single click a card to select it. The card highlights and a sticky bar slides up from the bottom of the screen showing the selected board (for example,
Selected · DASH-OEE-A). - Double click a card to open it immediately, skipping the bar.
From the sticky confirm bar you have three actions:
- Back to home returns to the app home screen.
- Open in new window opens the selected board in a new browser tab — useful for pushing a board onto a second screen while you keep working.
- The primary button reads View followed by the board's code (for example,
View DASH-OEE-A) and opens the board in the current tab.
dashboards.overview-02
Find a board fast
A filter strip sits under the hero with the prompt "Filter by dashboard name, code, or description…". Type any part of a board's name, its code, or its description and both sections narrow to matches as you type. If nothing matches, the picker shows "No dashboards match your filters." with a Clear filters button to reset the view.
Custom boards
Below the standard suite is a Custom boards section for dashboards your team builds. This in-app builder is still in development: the section currently shows a preview of the planned canvas and a short roadmap rather than a working editor, and there are no custom boards to open yet.
Build your own board today
To compose a board from individual widgets right now, use the Boards module. The Custom boards builder inside Dashboards will offer a drag-and-drop canvas in a future release.
Example: Granite Peak Manufacturing
At Granite Peak Manufacturing's Leeds Fabrication Plant, a shift lead starts the morning stand-up by opening the Dashboards tile from the Home screen. On the picker they type oee into the filter, single-click the OEE / Assets card to glance at the live machine states in the preview, then choose Open in new window so the board stays up on the line's wall display for the rest of the shift.
Mid-morning, machine stoppages are climbing. Back on the picker, the lead double-clicks Downtime · Pareto to open it directly and sees that a single reason code — tool change — is eating the most hours that week. They note it for the maintenance huddle and hand off to the day team, leaving the OEE / Assets board running on the wall.
What you can and cannot do yet
The Dashboards module is available, with two limits to keep in mind:
- The seven boards listed above are ready to open. Planning · OTD and Changeover · SMED are shown as previews only and cannot be opened yet.
- The Custom boards builder is in development. Until it ships, build your own boards in the Boards module.
Live previews and boards read data for the one site you have selected. Switch sites first if you need another plant's numbers.
Troubleshooting
- A card's preview shows an error block. Click the retry link on the card to re-run the live data fetch. If it still fails, confirm your role has that dashboard's permission from the list above.
- A card will not open and shows a status pill. That board (Planning · OTD or Changeover · SMED) is not yet available; there is nothing to fix.
- The grid is empty after typing in the filter. Your text matches no board name, code, or description. Choose Clear filters to see the full suite again.
- The numbers look wrong for your plant. Check which site is selected — the picker and every board scope to a single site at a time.
Related
- Insights and visual management — the wider reporting and visual-management area.
- Boards — compose custom boards from widgets.
- KPIs and Teamboards — related ways to track and share performance.
- Individual boards: OEE people, OEE assets, Quality Watch, Value Flow, Parts performance, and Downtime Pareto.
Use AI assistance with KPIs
Use the KPI Assistant to find, chart, and draft KPIs in plain language, then review and confirm each one before it is created.
Review OEE people
Read the OEE People dashboard to see each operator's running, downtime, and inactive time, per-person OEE, and output across a chosen day.