Review OEE timelines
Read the OEE Timeline to see how each asset or operator spent its time, categorise downtime, and correct mislabelled records within the last 48 hours.
Last updated
The OEE Timeline is an analytics view that lays out how your equipment and people spent their time as a horizontal, Gantt-style band per asset or per operator. OEE stands for Overall Equipment Effectiveness, a standard manufacturing measure that combines how much of the available time a machine was actually producing (availability), how fast it ran versus its expected rate (performance), and how much of the output was good (quality). The timeline turns raw production timers, downtime events, and recorded output into a single picture so you can see, hour by hour, when an asset was running, when it was stopped, and why.
Use this view when you want to move past a single headline percentage and understand the story behind it: which stops ate into a shift, whether a long "downtime" block was really one event or several, and whether the recorded reasons match what actually happened on the floor. Because the timeline reads directly from the same production records that feed every other OEE report, correcting a mislabelled or overrun record here fixes it everywhere.
Before you start
You reach the OEE Timeline from the left sidebar under Analytics → OEE Timeline, which offers two views:
- Assets: one row per asset, at
/analytics/oee-timeline/assets - Users: one row per operator, at
/analytics/oee-timeline/users
Two things must be in place before either view shows data:
- Permission to view. You need the "View OEE" permission (
analytics.view_oee). In a standard Bulk role setup this is granted to the Super user, Entity admin, Manager, and Dashboards roles. Without it the OEE Timeline entry does not appear in your sidebar. - At least one dashboard. Each view is driven by a saved dashboard that decides which assets or users appear. If none exists yet, the page shows an empty state ("No asset dashboards configured" or "No user dashboards configured") with a Go to Settings button that takes you to Settings → OEE → Dashboards or Settings → OEE → User Dashboards to create one.
Editing a record on the timeline (covered below) needs a separate permission and is described in its own section.
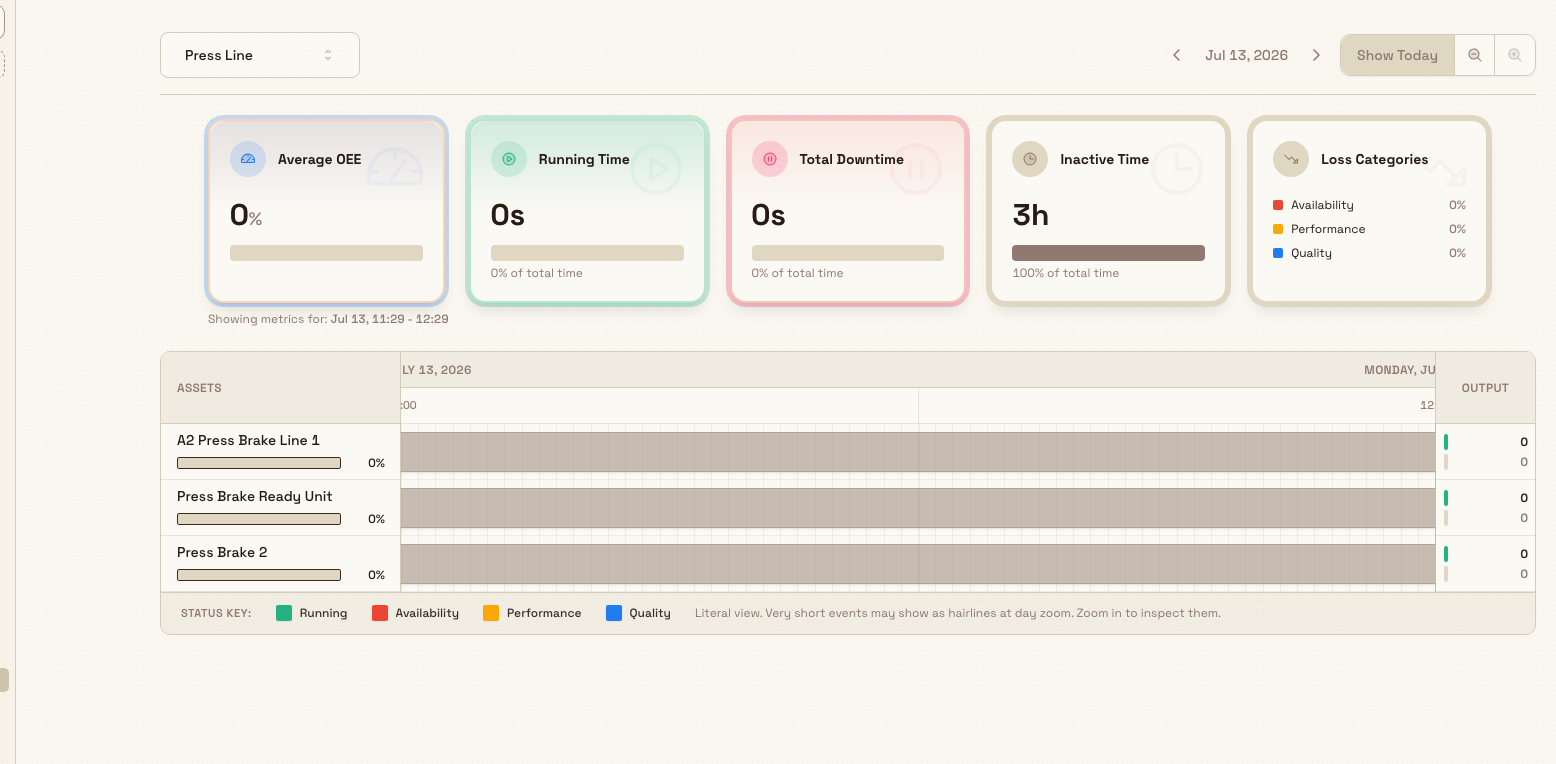
Choose a dashboard and a time window
The controls across the top of the page choose the dashboard and the day:
- Dashboard selector. The button on the left shows the current dashboard name; open it to search ("Search dashboards...") and switch. A star marks the default dashboard.
- Date controls. Use the left and right arrows to step one day back or forward, click the date to pick any day from a calendar, and click Show Today to jump back to the current day.
- Zoom. The magnifier buttons zoom the time axis in and out. The window is bounded: you can zoom in to as tight as one hour and out to as wide as seven days.
The view opens on a single day by default. Panning and zooming change only what is on screen, and the summary numbers recalculate to match the visible window. That window is the Showing metrics for: line at the bottom of the page, not the date in the top controls. The numbers you read always describe the span you are looking at.
Read the summary metrics
Above the timeline, the visible window is summarised as a plain row of numbers. The figures are not separate coloured cards.
On a wide screen you see five figures in that row. On a narrower screen they wrap. The labels are the same for assets and for operators:
- OEE is the percentage for the window. A bar under the number tracks that percentage and does not repeat it.
- Running is time spent producing. Downtime is stopped time. Inactive is time in inactive stretches, not running and not a recorded stop. Unknown time is not included in these three durations. Each one is a duration, such as 3h or 12m. A bar under it shows its share of those three durations, with the percentage beside the bar.
- Losses lists Availability, Performance, and Quality. Each line is that category's percentage of total downtime, next to a colour swatch. The list is not titled Loss Categories.
The date range for these numbers is not under the row. It sits at the bottom of the page, under the timeline and the colour key, and it is right-aligned. The first line starts with Showing metrics for: and then the start and end of the visible window. On a single day the end is only the time, for example "Jan 15, 14:30 - 16:00". The next line depends on the view:
- Assets: Asset-time is summed across all displayed assets.
- Users: Person-time is summed across all displayed users.
Panning and zooming update the row and that bottom line together.
Read the timeline
Each asset or operator gets one horizontal row. Coloured blocks (segments) along the row show what was happening at each moment. A colour key along the bottom of the timeline names the swatches. It has no Status Key heading.
- Running means the machine or person was producing.
- A stop takes the colour of its loss category: Availability, Performance, or Quality. There is no separate Downtime swatch. The Downtime figure in the summary is the total of those stops.
- Unknown is a hatched block for time the system could not attribute.
The key also prints this note: "Literal view. Very short events may show as hairlines at day zoom. Zoom in to inspect them." A brief stop can shrink to a thin line at a day zoom, so zoom in before you decide a gap is empty.
Hover any segment to see a tooltip. A downtime tooltip shows the reason name, its OEE category, the duration, start and end times, who added it, and any notes. The row also carries a small OEE percentage for that asset or person over the visible window, so you can compare rows at a glance.
Inspect a running segment
Left-click a running (green) segment to select it. Right-click it and choose View details to open a details dialog for that production run. It summarises how many recording batches were logged, how much was produced, and how many quality issues were recorded, alongside a mini-timeline and a batch-by-batch list with timestamps. In the Users view, clicking an operator's name opens that person's employee record on its production tab; if no employee record is linked, Bulk tells you so rather than opening an empty dialog.

Correct a record
The timeline is not only for reading. When a stop was logged against the wrong reason, or a timer overran because someone forgot to stop it, you can fix the record in place so the OEE figures reflect reality. These corrections change the underlying production records and are governed by two rules:
- Permission. Editing needs the "Manual timer entry" permission (
production_operate.timer_manual_entry), granted in a standard setup to the Super user, Entity admin, Tablet user, and Master data roles. Without it you can still view and inspect everything, but the edit affordances do not appear. - A rolling 48-hour window. You can only edit segments whose record started within the last 48 hours, and any new edge you set must also stay inside that window and never land in the future. Older history is read-only. If you try to reach outside the window, Bulk blocks the save with "Edits are only allowed for the last 48 hours."
When both conditions are met, three corrections are available:
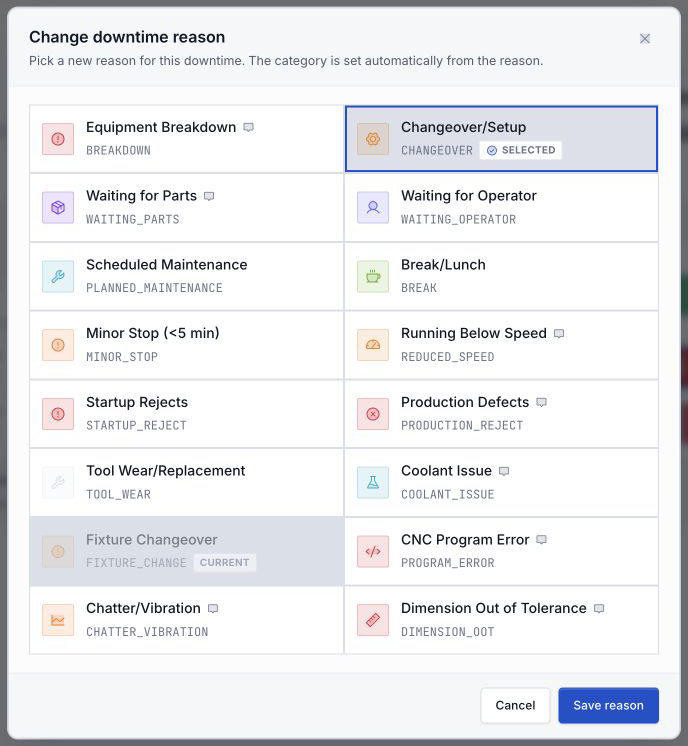
- Change a downtime reason. Right-click a downtime segment and choose Change downtime reason. Pick a new reason from the list and save; Bulk sets the loss category automatically from the reason you choose, so you never categorise it by hand. If the reason is configured to require a comment, a Notes field appears and must be filled before you can save.
- Resize a segment. Select an editable segment to reveal its edge handles, then drag either edge to lengthen or shorten it. The right-click menu shows a "Drag either edge to resize" hint whenever the segment is wide enough to grab.
- Fill a gap. If shrinking a running segment opens a gap next to a neighbouring block, a Fill gap with downtime dialog appears, pre-set to the freed span. Choose a reason to record that freed time as downtime, and Bulk shrinks the run and inserts the downtime in a single step.
Categories follow the reason
You never pick a loss category directly on the timeline. Availability, Performance, and Quality are copied from the downtime reason you select, so keeping your reason list well organised is what keeps the Losses list meaningful. Manage that list under Settings → OEE → Downtime reasons.
Example: reviewing a stop at Gotham Applied Sciences
Bruce Wayne opens the Gotham Review dashboard and zooms into a housing bench stop. Hovering the segment shows its reason, duration, start and end times, and who recorded it.
Suppose the crew confirms that a stop recorded as Equipment Breakdown was actually Tool Wear/Replacement. Bruce right-clicks the recent segment, chooses Change downtime reason, and picks the correct configured reason. Its Performance category follows automatically. He adds any required notes and saves only after confirming the correction with the crew. Cancel leaves the recorded stop unchanged.
If the crew confirms that a running timer overran, Bruce selects that recent running segment and moves its edge to the verified stop time. The Fill gap with downtime dialog records the freed time with the appropriate reason. He saves only when the revised boundaries match the station record.
Expected result
After a review pass, the visible window reflects reality: running blocks match the times production was actually happening, stops carry the correct reasons and loss categories, and the summary figures (OEE, Running, Downtime, Inactive, and Losses), the per-row OEE percentages, and every downstream OEE report update to agree. Because these are edits to the source records rather than annotations, the corrected picture is what everyone else sees too.
Limitations and feature state
- Editing is limited to the last 48 hours. Segments older than the rolling window are read-only for everyone. This is a deliberate guardrail so historical OEE cannot be rewritten long after the fact.
- Splitting and converting segments are not available. You can change a reason, resize a segment, and fill a resize-vacated gap. Splitting a single block into several, or converting a running block into downtime directly, are planned for a later release and are not part of this view today.
- Data freshness. The timeline reads from a maintained analytics layer that trails live activity slightly. When that layer is catching up, a banner appears above the timeline noting the delay and offering a retry; the figures settle once it recovers.
- A dashboard defines the scope. The view only shows the assets or users on the selected dashboard, so an asset missing from the timeline usually means it is missing from the dashboard, not that it had no activity.
Troubleshooting
- The OEE Timeline is missing from my sidebar. You likely lack the "View OEE" permission. Ask an administrator to grant a role that includes it (Super user, Entity admin, Manager, or Dashboards).
- The page says no dashboards are configured. No dashboard has been created for that view yet. Use the Go to Settings button to open Settings → OEE → Dashboards (assets) or Settings → OEE → User Dashboards (users) and create one.
- The save was blocked with "Edits are only allowed for the last 48 hours." The segment, or the new edge you set, falls outside the rolling 48-hour window. You can only correct recent records; older history cannot be changed here.
- I cannot see any edit options. Confirm the segment started within the last 48 hours and that your role includes the "Manual timer entry" permission. Very narrow segments cannot be dragged, so the resize hint is hidden until you zoom in far enough to grab an edge.
- A stop looks like it vanished. Short stops render as hairlines at a full-day zoom. Use the zoom-in control to inspect them before assuming the time was unattributed.
Related
- Configure downtime reasons: build the reason list that drives categories on this timeline.
- Analytics overview: the other analytics views alongside the OEE Timeline.
- Review OEE assets: the summary OEE dashboard for equipment.
- Review OEE people: the summary OEE dashboard for operators.
- Review downtime Pareto: rank downtime causes once you have categorised them here.
Review asset revenue
Read the Asset Revenue report to see how much sales value each machine or workstation earns, ranked by revenue and broken down by job and customer.
Use the asset board
Open the asset board for a full-screen live view of one site: station status, loaded jobs, and 24-hour sparklines for activity, efficiency, and output.