Review the Assets Sheet
Review the Assets Sheet, the station table in Analytics that lists every station on a board with live status, downtime, the loaded job, and rates.
The Assets Sheet is a live station table in Analytics. Open it from the Analytics menu at /analytics/assets-sheet, or from the Dashboards picker on the card named Assets Sheet, code DASH-ASSETS-S. Each row is one station on the selected asset board. In Bulk, that station is an asset: a machine or workstation on the shop floor, such as a press brake or a laser cutter. A site is one plant or location. The table is how you compare status, downtime, the loaded job, and the day's rates across every station on that board.
The Asset Board at /analytics/assets-board is the wall of station cards for the same board. A card is meant to be read from across the floor: a large status, a live timer, and the downtime reason when the station is paused or stopped. The Assets Sheet is that board as a table you can search, filter, and sort. Use the sheet at a desk when you need the row detail. Use the board when you want the wall display. The Dashboards picker lists the wall as Assets Board (DASH-ASSETS) and this table as Assets Sheet (DASH-ASSETS-S).
When to use the Assets Sheet
Use the Assets Sheet when you want one list of the stations on a board, not a grid of cards. Common uses:
- Scan which stations are running, paused, stopped, or idle, and sort the list so the problem rows rise to the top.
- Read the downtime reason, OEE category, loss type, and latest comment without opening each station.
- See the job loaded on a station, and the next job waiting in its queue.
- Compare the day's worked time, output, and rate once you show those columns.
- Leave the table open during a shift. It refreshes on its own.
The sheet answers "what is on each station right now," plus a short status history in the 24h, 7d, and 30d columns. For a full timeline of one asset or operator, use the OEE Timeline.
Before you start
You need the following to view a useful sheet:
- The View OEE analytics permission (
analytics.view_oee). This permission loads the sheet. It is granted by the Super user, Entity admin, Manager, and Dashboards roles by default. OEE stands for Overall Equipment Effectiveness, the standard measure of how well equipment is used. - At least one asset board for the site, with one or more assets on it. The sheet does not keep its own station list. It shows the stations on the board you open. If that board has no assets, the page shows an empty state instead of rows.
- A site (entity) selected in Bulk. The sheet always reflects one site at a time.
Creating a board, choosing its stations, and setting the daily reset time are done in settings, not on this page. See Configure the asset board.
Adding a follow-up on an open downtime comment needs a second permission, Pause production timer (production_operate.timer_pause). You can read the sheet without it.
Viewing versus configuring
This page covers reading a board that already exists. Creating boards, adding assets, choosing a default board, and linking an output target all happen in Settings, under OEE. The table itself is read-only, apart from downtime comments on an open event.
Open the Assets Sheet
From Analytics:
- Open the Analytics menu.
- Select Assets Sheet. The table opens at
/analytics/assets-sheet.
From Dashboards:
- Open Dashboards.
- Open the Assets Sheet card (
DASH-ASSETS-S).
The page fills the screen and hides the sidebar, same as the Asset Board. A back control in the header returns to the Dashboards picker. The header shows the current board name and, on a wide screen, the site name. The sheet loads the site's default board first.
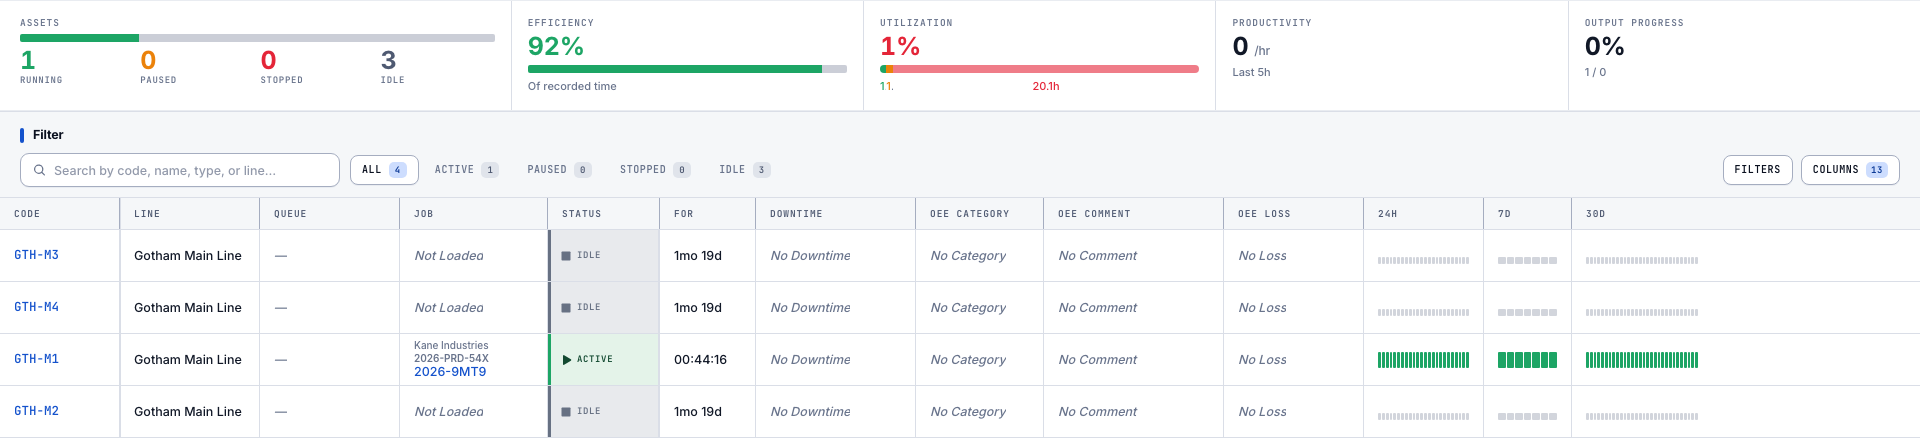
analytics.assets-sheet-01
Read the status summary
A strip across the top summarises the stations in view. It is not the wall of cards. The five parts are:
- Assets is a share bar plus four counts: Running, Paused, Stopped, and Idle. Running here is the same state the table calls Active.
- Efficiency is recorded-time efficiency for the production day: running time divided by running plus paused time. The footnote reads Of recorded time. The percentage is green at 80% or above, amber from 50% through 79%, and red below 50%. It stays neutral when the day has no recorded running or paused time.
- Utilization is how much of the production day the stations spent running. A bar under the percentage splits that day into running, paused, and idle. It uses the same 80% and 50% colour bands, and stays neutral when the day window has not started.
- Productivity is output recorded in the latest hour across the stations in the summary, rounded to a whole number, with /hr after it. If the board has a target rate, the footnote reads Target and that rate per hour. If it does not, the footnote reads Last 5h. There is no five-hour chart. The colour is separate from that hourly number: it shows whether today's output is keeping up with the target rate for the hours worked, and it stays neutral when there is no target.
- Output progress is today's output against the day's target, as a percentage. The footnote shows current output, a slash, and the target. It stays at zero until the board is linked to a daily output target.
The status pills under the strip (All, Active, Paused, Stopped, Idle) always count the whole board. They do not shrink when you search or filter. The summary strip does the opposite: once a search or filter is on, Assets, Efficiency, Utilization, Productivity, and Output progress recompute for the rows still listed. Output progress also scales the day's target by the share of stations still listed. Four stations still listed out of eight keep half the board target.
Daily figures reset at the board's Day Reset Time in the site's time zone. A reset time of 6:00 means the production day runs from 6:00 to 5:59 the next morning.
Filter the table
The toolbar above the rows has three controls. They apply together: a station has to pass the status pill, the search, and every section in the Filters panel.
Search matches part of the station code, name, type, or line. It does not search the job number, the queue, or the downtime reason. Matching ignores capital letters.
Status pills are All, Active, Paused, Stopped, and Idle. Pick one. The number on each pill is the count for the whole board.
Filters opens a panel with four sections. Tick any values you need. Within one section, a station matches if it has any ticked value. Across sections, it must match every section you used.
- Asset type: the types present on this board. If the board has none, the panel says No asset types on this board.
- Asset line: the lines present on this board. If the board has none, the panel says No asset lines on this board.
- OEE category: Availability, Performance, Quality, and No category.
- OEE loss: Breakdown, Changeover/Setup, Waiting, Planned Stop, Minor Stop, Reduced Speed, Idling, Startup Rejects, and Production Rejects. Custom loss types already used on this board are added to that list. No loss is always last.
No category and No loss include stations that are not in downtime, because those stations have no open reason to tag. Choices apply as you tick them. Show results closes the panel. Clear all in the panel, or on the chips under the toolbar, clears the search, the status pill, and the panel together.
Active choices appear as chips: Search, Status, Type, Line, OEE category, and OEE loss. Remove one chip to drop that choice only.
Read the columns
A fresh sheet shows Code, Line, Queue, Job, Status, For, Downtime, OEE Category, OEE Comment, OEE Loss, 24h, 7d, and 30d. Name, Type, Eff, Prod, Output, Rate, and Worked stay hidden until you turn them on. Code stays first and cannot be hidden.
| Column | On a fresh sheet | What it shows |
|---|---|---|
| Code | Yes, always | Station code. Select it to open the overview. The column stays pinned on the left. |
| Name | No | Asset name. Search still finds it while the column is hidden. |
| Type | No | Asset type, or a dash when the station has no type. |
| Line | Yes | Asset line, or No Line. |
| Queue | Yes | Next job ranked for this station, or a dash when nothing is ranked. |
| Job | Yes | Work loaded now, or Not Loaded. |
| Status | Yes | Active, Paused, Stopped, or Idle. |
| For | Yes | How long the station has been in that status. |
| Downtime | Yes | Open downtime reason, or No Downtime. |
| OEE Category | Yes | Availability, Performance, Quality, or No Category. |
| OEE Comment | Yes | Latest note on the open downtime event, or No Comment. |
| OEE Loss | Yes | Loss type on the open event, or No Loss. |
| 24h | Yes | Status bars for the last 24 hours, one bar per hour. |
| 7d | Yes | Status bars for the last 7 days, one bar per day. |
| 30d | Yes | Status bars for the last 30 days, one bar per day. |
| Eff | No | Today's output rate compared with the board target rate. |
| Prod | No | Today's output compared with what that target rate predicts. |
| Output | No | Output recorded today. |
| Rate | No | Today's output per worked hour. |
| Worked | No | Timer hours overlapping today, with an h after the number. |
Status and For
The table and the status pills say Active for a station whose production timer is counting. The summary strip counts that same state as Running. The other three words match in both places.
- Active (summary: Running), green: a production timer is counting at the station.
- Paused, amber: work is paused against a downtime reason from a timer or a sensor.
- Stopped, red: work is stopped against a downtime reason a person entered by hand.
- Idle, grey: no timer is running at the station. The station can be physically busy and still show Idle if nobody has a timer running there.
For is the time since the status last changed. Under a day it is a clock of hours, minutes, and seconds. After that it shortens to days and hours, then weeks, then months. It advances every second. A dash means Bulk has no start time for the current status.
Job and Queue
Job is the work loaded on the station now. Not Loaded means nothing is loaded. When work is loaded, the cell stacks the customer, the production order number, and the job numbers. Select a job number to open that job. Several jobs are separated by commas.
Queue is not the loaded job. It is the next job ranked for this station in Prioritisation. The cell shows that job number. If the rank has no job number, it shows the step name, then the part name. A +N badge counts how many more ranked jobs sit behind the first. A dash means the station has nothing ranked. Reading the queue uses the same View OEE analytics permission as the rest of the sheet.
Downtime, category, loss, and comment
Downtime names the open reason only while the row is Paused or Stopped. Otherwise it reads No Downtime, even if the station had a reason earlier in the day.
OEE Category comes from that open reason:
- Availability (red): the station was not available to run.
- Performance (amber): it ran slower than it should.
- Quality (blue): output had to be scrapped or reworked.
- No Category: the open reason has no category, or there is no open downtime event.
OEE Loss is the loss type on the open event, or on its reason. Standard names are Breakdown, Changeover/Setup, Waiting, Planned Stop, Minor Stop, Reduced Speed, Idling, Startup Rejects, and Production Rejects. A custom loss type shows the text your site stored. No Loss means there is no loss type on an open event.
OEE Comment shows the latest note, the author, and how long ago it was written. When a downtime event is open, select the cell to read the thread or add a follow-up. The box asks you to add a follow-up. Enter sends the note. If the station has no open downtime event, the cell reads No Comment and does not open a thread. Sending a note needs Pause production timer (production_operate.timer_pause).
24h, 7d, and 30d
These three columns are status history, not output charts. Each bar is the state that occupied the most time in that bucket. The oldest bar is on the left.
- Green is Active, amber is Paused, red is Stopped.
- Idle is a short grey bar.
- No data is fainter than Idle. A gap in the history must not look like a station that was genuinely sitting idle.
Point at the bars to see the counts. The labels are Last 24 hours, Last 7 days, and Last 30 days. A dash means there is no history for that window yet. Hiding all three columns stops the sheet from loading that history.
Eff, Prod, Output, Rate, and Worked
These five columns are hidden until you show them. They describe the current production day on this board.
- Output is the quantity recorded today.
- Worked is production-timer time that overlaps today.
- Rate is today's output divided by that worked time, as units per hour.
- Eff is that rate compared with the board's target rate per hour, as a percentage.
- Prod is today's output compared with the output that target rate would predict from the hours worked.
Eff and Prod use colour: green, amber, red, or neutral. They stay at 0% in a neutral colour when the board has no target rate per hour. The Asset Board settings page does not include a field for that rate, so these two columns often stay neutral. The summary Efficiency figure is a different number. It is time spent running out of recorded time, not this rate comparison.
The overview repeats Status, Output, Rate, and Worked, plus Efficiency and Productivity as the same percentages as the Eff and Prod columns. Those two dialog figures are not the summary strip's Efficiency, and they are not the hourly Productivity number. They show even when those columns are hidden.

analytics.assets-sheet-02
Choose which columns you see
Select Columns at the end of the filter toolbar.
- Tick a column to show it, or clear it to hide it. Code stays ticked.
- Drag a row in the menu to move that column. Code stays first. You can also right-click a heading and choose Move left or Move right.
- Reset restores the fresh column set and the original order. It does not restore column widths you have dragged.
Right-click a heading for Sort ascending, Sort descending, Move left, Move right, and Hide column. A normal click on a heading sorts by that column, and a second click reverses the order. Active sorts before Paused, then Stopped, then Idle. For sorts by how long the station has held its status. Bulk remembers the column order, which columns are hidden, the widths, and the sort for you on this table.
Drag the edge of a heading to change that column's width.
Open a station overview
Select the station Code. The overview title is the asset name. The description reads Live station snapshot and OEE timeline over the last 7 days.
The dialog shows six figures for the current production day: Status, Efficiency, Productivity, Output, Rate, and Worked. Efficiency and Productivity here are the per-station percentages. When the station is paused or stopped, a line names the downtime reason. Under that, Last 7 days stacks one OEE timeline strip per day. Close leaves the dialog. The overview does not open the Asset Board. Go to Analytics, then Asset Board, when you want the wall of cards.
If the timeline cannot load, the dialog says Could not load the OEE timeline. Close and try again.
Switch between boards
A site can have more than one asset board, for example one per line. When two or more boards exist, the board name in the header opens a menu labelled Switch board:
- Open the board name in the header.
- Choose another board. The default board is marked with a star.
Switching boards adds the chosen board's ID to the page address as a board query parameter, so you can bookmark a specific board. If the site has only one board, the name still shows, but it is not a menu, and that board loads automatically.
The sheet and the Asset Board share this list. A board you pick on one page is the same board you can open on the other.
How the sheet stays current
The sheet uses the same live board data as the Asset Board. It keeps itself current without a manual refresh:
- It updates within seconds when operators start, pause, or stop timers, or record output.
- It refreshes on its own about every half a minute while the tab is visible.
- It refreshes when you return to the tab or when the connection comes back after a drop.
For keeps counting every second between those refreshes. The 24h, 7d, and 30d bars refresh with the sheet, and only while at least one of those columns is visible.
Example: Leeds Fabrication Plant station table
Granite Peak Manufacturing runs the Leeds Fabrication Plant. The shift supervisor wants a list, not the wall display, so they open Assets Sheet on the Leeds Shop Floor board.
Mid-morning the summary Assets count reads 5 Running, 1 Paused, 1 Stopped, and 1 Idle. The supervisor selects the Stopped pill. The pill counts stay at the whole-board numbers, and the summary shrinks to the one stopped row.
That row is weld bay WB-04:
- Status is Stopped, and For is past 40 minutes.
- Downtime reads Tooling fault. OEE Category is Availability. OEE Loss is Breakdown.
- Job shows the customer, the production order, and a job number. The supervisor selects the job number to see what was loaded when the bay stopped.
- Queue shows the next ranked job and a +2 badge, so two more jobs are waiting behind it.
- The 24h bars are mostly green, then a red bar for the current hour.
The supervisor leaves the filter on, walks to WB-04, and leaves the wall display on the Asset Board for the rest of the floor. No export, just the table.
Expected result
You have a full-screen table of one board's stations. You can see how many are running, filter to the ones that are stopped, read the reason and the loaded job, and open a seven-day timeline from the station code. The figures follow the board's production day and update while the page is open.
Limitations and availability
- The Assets Sheet is generally available.
- The table reads one asset board. Stations that are not on that board, or that are inactive, do not appear. Change the board list in settings. See Configure the asset board.
- Code cannot be hidden or moved. It stays the first column.
- Name, Type, Eff, Prod, Output, Rate, and Worked are hidden on a fresh sheet. Turn them on from Columns. Reset brings back the fresh set.
- Search does not cover jobs or downtime text. It matches code, name, type, and line only. Use the status pills and the Filters panel for downtime category and loss.
- The Downtime column is blank of a reason unless the station is paused or stopped. It then reads No Downtime.
- Eff and Prod need a target rate per hour on the board. Without one they stay at 0% in a neutral colour. Asset Board settings do not offer a field for that rate.
- Output progress needs a linked daily target. It stays at zero until the board is linked to a daily output KPI and a target is set for the day. See Set KPI targets. With a filter on, the target shown is the board target scaled to the share of stations still listed.
- Summary colours are not all on the same scale. Efficiency and Utilization on the strip use 80% and 50%. Productivity, Output progress, and the Eff and Prod columns follow the board's efficiency thresholds. The settings form does not expose those thresholds.
- Comments are the only write action on this page. You need an open downtime event, and Pause production timer, to add one. You cannot start or stop a timer here.
- The overview does not jump to the Asset Board. Open
/analytics/assets-boardfor the wall of cards. - The board menu only appears with two or more boards. With a single board, that board loads automatically.
- The sheet reflects one site at a time. Switch the selected site to see a different plant.
Troubleshooting
- The sheet shows "No assets configured." The board you opened has no assets on it. Select Go to settings, or open Settings, then OEE, then Asset Board, and add assets. See Configure the asset board.
- The sheet says "No entity selected." Choose a site. The message under the heading reads Select an entity to load the asset sheet.
- The sheet will not load or shows an error. Confirm your role has View OEE analytics. Without it, the sheet cannot read its data.
- A station you expect is missing. It is not on this board, or it is inactive. Edit the board, or switch to a board that includes it.
- Every station shows Idle. No production timers are running for those stations. Live status comes from timers on the shop floor. See Run production timers.
- The table says "No results found." The search or the filters excluded every row. If you searched, the empty state names the term and offers Clear search, which also clears the status pill and the Filters panel. If you only used filters, the empty state says Try adjusting your filters.
- Downtime reads "No Downtime" but you expected a reason. The row is Active or Idle. The reason is shown only for Paused and Stopped. If a paused or stopped row still has no name, the downtime event has no reason. See Configure downtime reasons.
- Eff and Prod are 0% for every station. The board has no target rate per hour. That rate is not set from the Asset Board settings form.
- Output progress stays at 0%. Link a daily output KPI and set a target for today. See Set KPI targets.
- The history columns are a dash, or the bars look faint. A dash means that window has no buckets yet. A faint bar is No data, a gap in the history, not an idle station.
- You cannot add a comment. The station needs an open downtime event. If the thread opens but sending fails, ask an administrator for Pause production timer.
Related guidance
- Use the asset board: the wall of station cards for the same boards.
- Configure the asset board: create boards, choose stations, set the reset time, and link an output target.
- Configure downtime reasons: set the reasons, OEE categories, and loss types the sheet displays.
- Run production timers: the shop-floor timers that drive live status.
- Record production output: how output feeds the day's figures.
- Set KPI targets: set the daily target behind Output progress.
- Review OEE timelines: per-asset history beyond the seven-day overview.
- Dashboards: the picker that opens this sheet from
DASH-ASSETS-S. - Analytics: the full set of analytics views.
For finance teams
Where finance and billing teams work in Bulk: raise, approve, and issue invoices and credit notes for production, and set up the pricing and currencies behind them.
Analytics
Choose an Analytics view: OEE Timeline, Asset Board, Assets Sheet, 5S Dashboard, or Asset Revenue. See what each one shows and who can open it.