Configure OEE dashboards
Create and manage asset OEE timeline dashboards for a site — choose which machines appear, set display options, pick a default, and keep the Analytics OEE Timeline ready for the floor.
An OEE dashboard (configured here as an asset dashboard) is a named view of selected machines for the OEE Timeline. Each dashboard lists which assets to show, optional display choices (production counts and OEE scores), and whether that view is the site’s default. People open the live timeline under Analytics; this Settings page is where you create and maintain those views.
Use asset dashboards when you want a clean timeline for one line, one hall, or a fixed set of critical machines — for example a “Press line” view for day supervisors and a “Full plant” view for the production meeting. Dashboards are shared for the site: everyone with OEE analytics access can use them; only people with manage permission can create, edit, reorder, duplicate, or delete them.
A separate User Dashboards page under Settings → OEE configures people-based timeline views (who is running or down). That flow is not covered here.
Before you start
Open Settings, expand the OEE group, and select Asset Dashboards. The page header reads OEE Dashboards. The page address ends in /settings/oee/dashboards.
You need permission for this site:
- View the list requires View OEE analytics (
analytics.view_oee). - Create, edit, reorder, set as default, duplicate, and delete require Manage OEE dashboards (
analytics.manage_oee_dashboards).
Manage access is granted by the built-in Super user, Entity admin, and Manager roles. The Dashboards role can view OEE analytics (and therefore open this list when the sidebar is available) but does not include manage permission — so Add Dashboard and row actions that change data need a role that includes Manage OEE dashboards. Permission labels describe the capability as applying for the selected site.
Dashboards are per site (entity). Each plant keeps its own catalogue and its own default. Switch site first if you need to configure another facility.
You also need assets already defined for the site. The create form requires at least one asset. Asset options appear as code - name from the site’s asset catalogue. If the multi-select is empty, add or activate assets under master data first, then return here.

administration.oee.dashboards-01
What the page shows
When at least one dashboard exists, the page is a sortable table:
| Column | What it shows |
|---|---|
| Name | Dashboard name. The default dashboard shows a star next to the name. |
| Description | Optional notes, or a dash when empty. |
| Assets | A badge with the number of assets (for example 3 assets or 1 asset). |
| Actions | A three-dots menu per row. |
Drag the leading handle on a row to reorder the list. Order is saved for the site so the sequence stays consistent in this table and when people pick a dashboard on the timeline.
If the site has no dashboards yet, the page shows No dashboards yet with the message “Create OEE dashboards to visualize asset status and downtime.” and an Add Dashboard action.
Add a dashboard
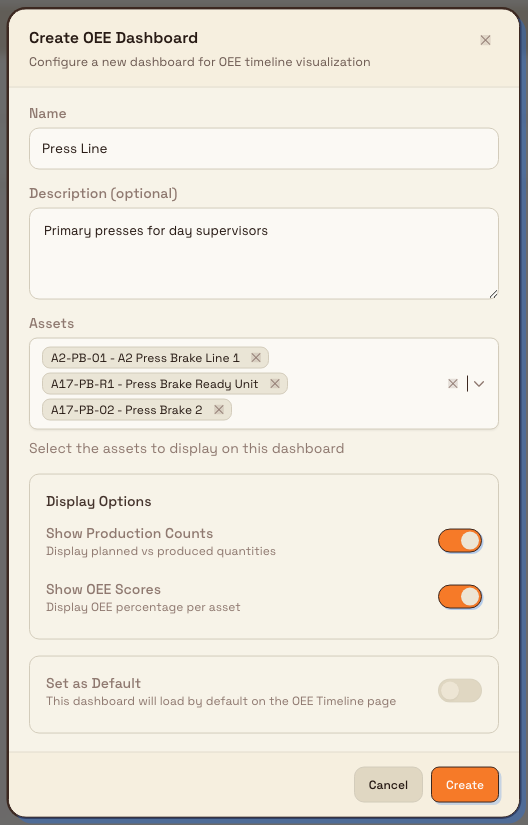
- Select Add Dashboard. The Create OEE Dashboard dialog opens with the description “Configure a new dashboard for OEE timeline visualization”.
- Enter a Name (required, up to 100 characters), for example
Press Line. - Optionally enter a Description (up to 500 characters).
- Under Assets, select at least one machine from the multi-select. Options use the asset’s code and name. The helper text reads “Select the assets to display on this dashboard”.
- Under Display Options, set:
- Show Production Counts — “Display planned vs produced quantities” (on by default).
- Show OEE Scores — “Display OEE percentage per asset” (on by default).
- Optionally turn on Set as Default. The helper text explains that this dashboard will load by default on the OEE Timeline page. Only one dashboard is the default for the site; making this one default clears the previous default.
- Select Create (or Cancel to close without saving).
A confirmation reads Dashboard created, with a short note that the named dashboard was created successfully. New dashboards are also given a sensible default timeline layout (today’s range at hour zoom, with downtime labels and running segments shown); those defaults apply when the timeline opens and are not separate fields on this form.
administration.oee.dashboards-02
Manage existing dashboards
Open the three-dots menu on a row. Available actions:
- Set as default — shown only when the row is not already the default. Confirmation: Default updated (“… is now the default dashboard.”). The previous default loses its star.
- Duplicate — copies name (with ** (Copy)** appended), description, assets, and layout. The copy is never the default. Confirmation: Dashboard duplicated.
- Edit — opens Edit OEE Dashboard (“Update dashboard configuration”) with the same fields as create. Submit with Save Changes (confirmation: Dashboard updated), or Cancel.
- Delete — shown only when
can_deleteis true: the user has manage permission and the dashboard is not the default. The Delete Dashboard dialog asks for confirmation and states that the action cannot be undone. Confirmation: Dashboard deleted. Soft-delete removes it from the list; it no longer appears on the timeline picker.
If Delete is missing on a row that you expect to remove, check whether that dashboard is the default (star next to the name). Set another dashboard as default first, then delete.
Reorder
Drag rows using the table’s drag handle. The new order is saved for the site. If reorder fails, an error toast appears and the list returns to the last saved order.
Where people use these dashboards
After you create at least one asset dashboard, open Analytics → OEE Timeline → Assets (address ends in /analytics/oee-timeline/assets). The timeline loads the default dashboard when one is set, and people can switch among the site’s dashboards. If no asset dashboards exist, that page shows No asset dashboards configured and points operators to Settings → OEE → Dashboards (this page) with a Go to Settings action.
Example: press-line view at Granite Peak Manufacturing
At Granite Peak Manufacturing’s Leeds Fabrication Plant, Dana Winters wants supervisors to open a short list of presses instead of every machine on site.
She opens Settings → OEE → Asset Dashboards, selects Add Dashboard, and names it Press Line. She selects the three press assets from the multi-select, leaves Show Production Counts and Show OEE Scores on, turns on Set as Default, and selects Create. Later she adds a second dashboard named Full Plant with every active asset for the weekly review, leaves it non-default, and drags Press Line above Full Plant so the list order matches how the team talks about the views.
On the floor, a supervisor opens Analytics → OEE Timeline → Assets and lands on Press Line automatically. When the plant manager needs the wider picture, they switch to Full Plant from the timeline’s dashboard selector.
Expected result
- The OEE Dashboards table lists each named view with description, asset count, and a star on the default.
- The default dashboard is the one that loads first on the asset OEE Timeline for that site.
- Timeline rows match the assets you selected; production counts and OEE scores appear when those display options are on.
- Timeline calculations use only sessions and events that overlap the selected time range, including work that started before the range and continued into it.
- OEE summaries and trends stay responsive across supported date ranges without changing their calculated values.
- Reordering and duplicating give you a controlled set of views without rebuilding from scratch.
Feature state and limits
Configuring asset OEE dashboards is a generally available feature. Keep these behaviours in mind:
- Dashboards are per site and shared with users who can view OEE analytics on that site.
- You must select at least one asset to create or save a dashboard.
- Only one default asset dashboard exists per site.
- You cannot delete the default dashboard until another dashboard is set as default.
- Delete is a soft delete: the dashboard disappears from lists and pickers; the UI treats removal as permanent for operators.
- User Dashboards (Settings → OEE → User Dashboards) are a separate catalogue for people-based timelines under Analytics → OEE Timeline → Users.
- The create form sets a fixed default layout (today, hour zoom, downtime labels and running segments on). Fine-grained time range and zoom while viewing are controlled on the timeline itself, not as separate admin fields on this page.
Troubleshooting
- "Select at least one asset" — the Assets multi-select is empty or was cleared. Choose one or more assets before Create or Save Changes.
- Asset list is empty — no assets (or none visible) for this site. Create or restore assets in master data, then reopen the dialog.
- Delete is missing — the dashboard is the default, or you lack manage permission. Set another dashboard as default first, or ask an admin for Manage OEE dashboards.
- "Cannot delete the default dashboard. Set another dashboard as default first." — the API blocks deleting the default even if the menu somehow offered it. Set a different default, then delete.
- Add Dashboard or row actions fail — you may have view-only access (
analytics.view_oeewithoutanalytics.manage_oee_dashboards). Use a role such as Entity admin or Manager. - Timeline says "No asset dashboards configured" — this site has no active asset dashboards. Create one here, then return to Analytics → OEE Timeline → Assets.
- Wrong machines on the timeline — edit the dashboard’s Assets selection (or open the wrong dashboard on the timeline). Confirm you are on the intended site.
Dates and time zones
OEE dashboards calculate today and day-based ranges in the selected plant's timezone. Recorded production and downtime events preserve their exact moments, while weekly views use the organization's shared week-start rule.
Related
- Configure the asset board — live asset status board settings for the same OEE area.
- Configure downtime reasons — reason codes that label downtime on timelines and boards.
- Manage assets and layouts — the asset catalogue this page picks from.
- Review OEE assets — using the asset OEE view day to day.
- Manage roles and permissions — grant view and manage OEE dashboard permissions.
Configure shifts
Define named work shifts with multi-week rotation patterns, daily start and end times, and breaks so employee records and scheduling share a consistent catalogue per site.
Configure the asset board
Set up TV-ready asset boards per site: choose which assets appear, when the day resets, which daily output KPI drives progress, and which board loads by default.