Teamboards
Run a plant's daily SQDCP visual-management board — safety, quality, delivery, cost, and people indicators, live widgets, and daily reports — on a shop-floor screen.
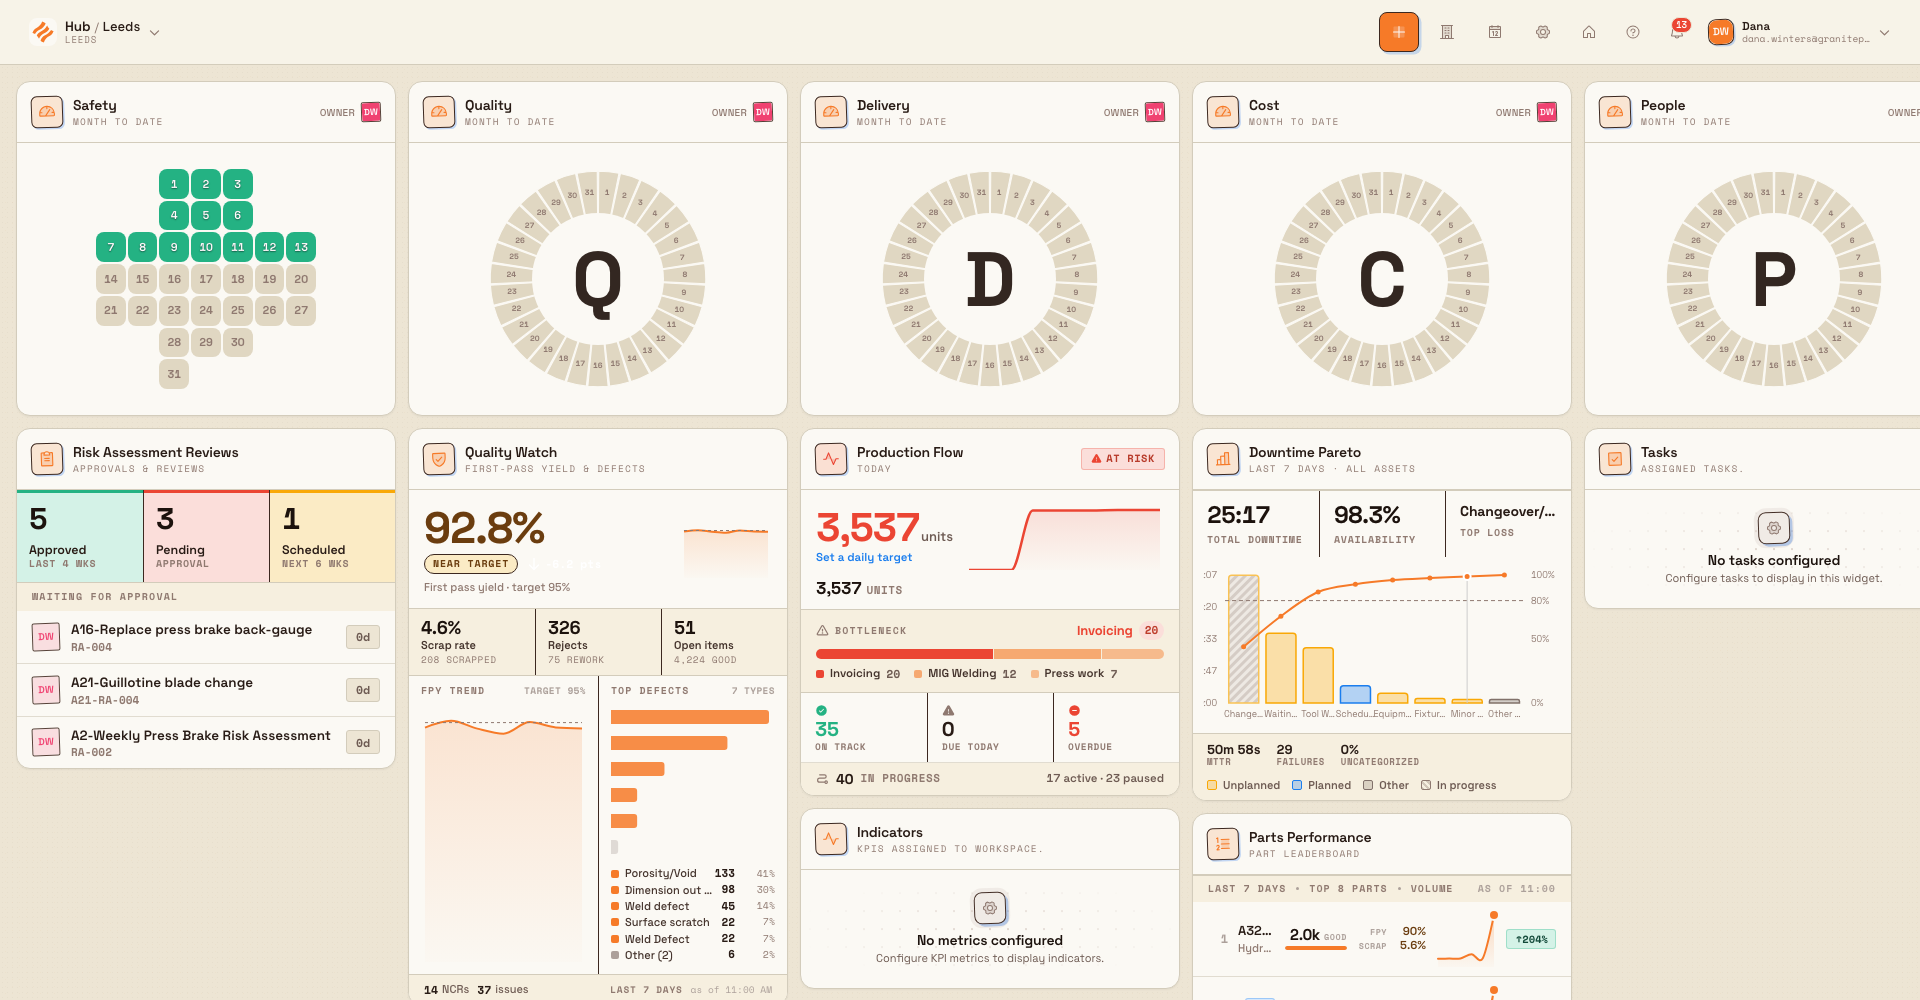
A Teamboard is a digital daily-management board for one plant or site. It arranges your shop-floor metrics into the classic SQDCP columns — Safety, Quality, Delivery, Cost, and People — so a team can hold its daily stand-up in front of one live screen instead of a printed whiteboard. SQDCP is a lean visual-management framework that keeps a team's attention on the same five areas every day, in the same order.
Each Teamboard runs full-screen, without the app's usual sidebar and header, so it reads clearly on a wall-mounted display. The data is live: as people record results and update KPIs elsewhere in Bulk, the board reflects the change without a manual refresh.
Use a Teamboard when you want a single, always-current view of how a plant is performing today, and a shared surface for the team to review issues, assign owners, and agree on actions.
teamboards.overview-01
How a Teamboard is built
Every Teamboard is made of a few repeating pieces. Understanding them makes the rest of the section easier to follow.
- Plant — each board belongs to one plant (an entity, or site, in Bulk). You pick which board to view from a plant switcher, and each board carries its own name, location, and columns.
- Indicator columns — the SQDCP columns. A new board starts with five: Safety, Quality, Delivery, Cost, and People, in that order. Each column shows one indicator at the top plus any number of widgets beneath it.
- Indicators — the at-a-glance status for a column. A column uses one of two indicator styles: a safety cross (a month-shaped grid where each day is coloured green for on-target, red for an issue, or grey for a future day) or a circular gauge (a dial that fills toward a KPI target). By default Safety uses the safety cross and the other four use a circular gauge.
- Widgets — the cards, charts, and tables inside each column. You add these from a searchable Widget Marketplace grouped into Metrics, Charts, Tables, and Utility.
- Reports — the daily updates. A report records the day's KPI actuals for a plant on a chosen date, which is what drives the gauges and daily statuses.
- Owners and deputies — the people accountable for each SQDCP column, shown on the board so everyone knows who owns Safety, who owns Quality, and so on.
Who can use Teamboards
Teamboards use two levels of access, both granted through roles in Settings.
- View a board needs the
teamboards.viewpermission. In the standard role set this is held by the Operator, Manager, Entity admin, Dashboards, and Super user roles — so most shop-floor and supervisory roles can read a board. - Create, edit, or delete a board needs
teamboards.create,teamboards.update, orteamboards.delete. In the standard role set these are held by the Manager, Entity admin, and Super user roles. If you open a board's settings without the update permission, Bulk shows a "forbidden" page instead.
Two more things matter for a board to show real data:
- You must have access to at least one of the entities the board draws from. A board aggregates data for its owning entity plus any entities assigned to it; if you have no access to any of them, the board will not open for you.
- A circular-gauge indicator needs a KPI with a target behind it. Without a KPI and target, the gauge has nothing to measure against. See KPIs to set these up.
What you can do
The Teamboards section is a small set of tasks. Each one has its own guide — follow the links for step-by-step instructions.
- Open and switch boards. From the main navigation, open Teamboards, then Teamboards, to reach the plant switcher (titled "Select Teamboard"). Pick a plant card to open its board, or use the Switch Plants button (the building icon) on an open board to jump to a different one. See Select a Teamboard plant.
- Record the day's results. Use New report (the plus button on the board, also available from the navigation) to choose a plant and date and enter that day's KPI values. This is what turns a gauge green or marks a day on the safety cross. See Create a Teamboard report.
- Customize the board. Enter edit mode with the settings gear to rearrange widgets, add new ones from Add Widget, and tune indicator colour rules. Open a board's settings page to rename the plant, choose which entities it aggregates, set each column's indicator style, and assign owners. See Use and manage a Teamboard.
- Ask the built-in assistant. While editing a board you can open the AI assistant to make changes and answer questions using Teamboard tools. See Use AI assistance with Teamboards.

teamboards.overview-02
Example: a morning stand-up at Granite Peak Manufacturing
Granite Peak Manufacturing runs a daily production stand-up at its Leeds Fabrication Plant. A wall-mounted screen near the line shows the plant's Teamboard, opened to today's date.
At 07:30 the shift lead walks the team through the five columns in order. Safety shows a safety cross that is green for every day this month, so the count of incident-free days keeps climbing. Quality shows a circular gauge for right-first-time that has slipped just under target overnight, turning amber, so the Quality owner notes a check on the previous run. Delivery and Cost gauges are on target and green. People shows who is on shift.
Because yesterday's numbers were captured through New report, the gauges already reflect reality — nobody has to update the board by hand during the meeting. When the team agrees to investigate the quality dip, the Quality owner is already named on the column, so the action has a clear home. The whole review takes a few minutes, and the same board stays live on the screen for the rest of the shift.
What to expect
- Opening a board shows the plant's SQDCP columns with live indicators and widgets. The board defaults to today's date, which suits an always-on display; you can view a different day with the Select date button (the calendar icon).
- Indicators and widgets load independently. A slow or unavailable widget does not stop the rest of the board, and values that have already loaded stay visible while live data refreshes.
- Submitting a report updates the indicators and any KPI-driven widgets for the chosen plant and date.
- Layout and configuration changes you make in edit mode are saved to the board, and Bulk confirms with a "Teamboard layout saved" message. Everyone viewing that board sees the update.
Feature state and limits
Teamboards are generally available. A few limits are worth knowing:
- Indicator KPI limit. A board loads at most 10 KPIs across all of its indicators. If a board is configured with more, Bulk warns that only the first 10 will be shown in indicators, to protect performance.
- Entity limit per board. A board loads data for at most 10 assigned entities. Beyond that, Bulk warns that only the first 10 will be displayed.
- One board per screen. A board is chosen per browser tab through its plant selection, so a single screen shows one plant's board at a time. For a cross-plant, roll-up view, use Atlas instead.
Deleting a board is permanent
A board's settings page includes a Danger Zone that permanently deletes the board and all of its associated data. There is no undo. Only delete a board you are certain is no longer needed, and confirm you have the right plant open first.
Troubleshooting
- The board says "No plant selected." You reached the board view without choosing a plant. Use the Switch Plants button, or open Teamboards then Teamboards from the navigation, and pick a plant card.
- A settings page shows a "forbidden" message. Managing a board needs the
teamboards.updatepermission. Ask an administrator to grant a role that includes it, or have someone with that role make the change. - A gauge is empty or never turns green. The column's indicator needs a KPI with a target, the plant must be assigned the entities that produce that data, and a report must record actuals for the day. Confirm all three, then re-open the board.
- A board seems to be missing KPIs or plants. Check the indicator and entity limits above — a board only loads the first 10 KPIs and the first 10 assigned entities. Trim the configuration if you have hit either limit.
Teamboard value KPIs use payable job and order totals that include assigned order services.
Dates and time zones
A Teamboard's selected day and today state use the board's plant timezone, not the display device's timezone, so a wall display and a remote viewer see the same plant day. Weekly figures use the organization's shared week-start rule.
Related guidance
- Select a Teamboard plant
- Create a Teamboard report
- Use and manage a Teamboard
- Use AI assistance with Teamboards
- KPIs — the metrics and targets behind Teamboard indicators
- Atlas — the cross-plant executive roll-up
Review downtime Pareto
Read the Downtime Pareto dashboard to rank stoppage reasons by lost time, find the vital few losses, and drill from a reason or machine down to individual downtime events.
Select a Teamboard plant
Open the Teamboards plant switcher to pick a shared SQDCP board to view, jump into a board's settings, or create a new board — with one card per teamboard you can access.