Safety
The Safety area brings risk assessments, incident reports, and equipment readiness onto one dashboard and links to the guide for each safety task.
Last updated
The Safety area is the health-and-safety home for your plant in Bulk. It gathers the three things a safety team tracks day to day — the risk assessments that document hazards and their controls, the incidents that record events after they happen, and the pre-use checks that decide whether a machine is cleared to run — and presents them on a single dashboard, with a link through to the guide for every task.
Use this area when you want the current safety picture at a glance: how many risk assessments are live, what is waiting for a manager to sign off, whether any incident is still open, and how many machines are overdue for an inspection. From here you move to the detailed screens to create, review, approve, or investigate.
A quick vocabulary check, since these terms recur throughout the area:
- A risk assessment is a structured record of a hazard — how likely it is, how severe it could be, and the controls that reduce it. Bulk scores each one and flags the high and critical ones.
- An incident is a safety event that has already happened, such as an injury, a near miss, or equipment damage, that you report and then investigate.
- A pre-use check is a short safety inspection an operator completes before using a machine — for example confirming guards are in place and the emergency stop works.
- An asset is any piece of equipment you track, such as a press brake or an overhead crane.
- An entity is a single plant or site. The Safety area always shows the plant you are currently signed in to; switching entity switches the safety picture.
What you can do from the Safety area
The Safety section in the left navigation (its icon is a shield) opens to these pages:
- Home — the safety dashboard described below, at
/safety/home. - Asset Readiness — a plant-wide view of which machines are cleared to run and which are blocked by an unfinished pre-use check.
- Risk Assessments — the list where you create, score, submit, approve, and review risk assessments.
- Risk Matrix — a standalone view of the likelihood-by-severity grid Bulk uses to turn a score into a risk level.
- Incidents — the log where you report, investigate, and close safety incidents.
Each of these has its own step-by-step guide, linked under Guides for each safety task below. This page explains the dashboard and points you to the right guide.
Before you start
To open the Safety area you need the View safety permission (safety.view). In the default role set that permission is granted to the Super user, Entity admin, Manager, and the dedicated Safety role. Creating, approving, or investigating requires the matching action permissions — for example safety.create_assessment to start a risk assessment, safety.approve_assessment to approve one, safety.create_incident to report an incident, and safety.approve_incident to approve one — which the same roles hold by default.
If you cannot see the Safety section in the navigation, or the dashboard loads without data, ask an administrator to confirm your role includes View safety for the plant you are working in. The dashboard is scoped to the current entity, so its numbers reflect only the plant you are signed in to.
Reviewing versus doing
The Safety home page is a dashboard: it summarises and links, but the actual work — creating an assessment, approving it, reporting an incident, completing a check — happens on the dedicated screens this page links to.
The Safety home dashboard
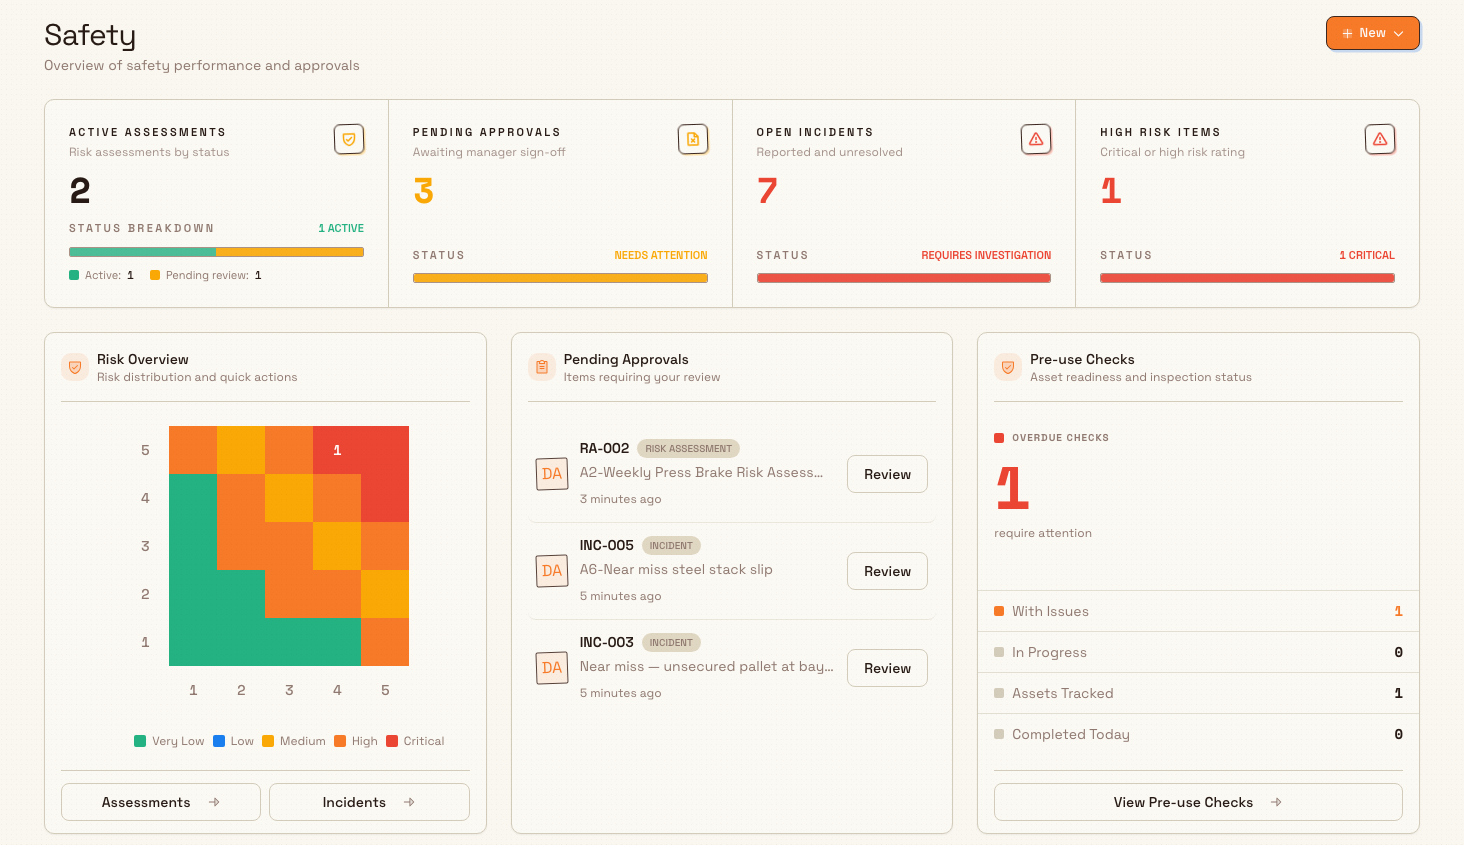
Open Safety → Home to reach the dashboard. It is headed Safety with the subtitle "Overview of safety performance and approvals", and a New button in the top right for starting a record without leaving the page.
The summary strip
The strip across the top gives you the plant-wide picture in four tiles:
- Active assessments: the large number shows the total assessment records. The smaller active count identifies the live assessments, and the bar breaks records down by status (Active, Pending review, Draft, Refused, Archived).
- Pending approvals — risk assessments and incidents waiting for a manager to sign off. When this is above zero the tile reads Needs attention; when it is clear it reads All caught up.
- Open incidents — incidents that have been reported and not yet closed. Above zero, the tile reads Requires investigation.
- High risk items — active assessments whose overall score lands in the high or critical band. Above zero, the tile calls out how many are critical.
The three widgets
Below the strip sit three widgets:
- Risk Overview — "Risk distribution and quick actions". It shows the Risk Matrix, a grid that plots your active assessments by likelihood and severity, with quick links to Assessments and Incidents.
- Pending Approvals — "Items requiring your review". It lists the risk assessments and incidents awaiting sign-off, each with a Review action; when nothing is waiting it reads "No pending approvals" and "You're all caught up!".
- Pre-use Checks — "Asset readiness and inspection status". It leads with the number of Overdue Checks, then lists assets With Issues, checks In Progress, Assets Tracked, and checks Completed Today, with a View Pre-use Checks button that opens Asset Readiness.
Start a new record
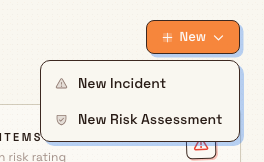
Select New in the top right to open a short menu with two choices: New Incident, which opens Safety Incident Drafts so you can continue a draft or select Start New Draft, and New Risk Assessment, which takes you to the risk assessments list to begin one.
Non-zero safety counts mean real exposure
A count above zero in Open incidents or High risk items points to a live safety issue at your plant, not just a number on a screen. Treat these tiles as a to-review list: open each item, confirm the controls or investigation are in hand, and do not leave a high-risk assessment or an unresolved incident unattended.
Example: a shift review at Gotham Applied Sciences
At Wayne Corp, Bruce opens Safety → Home before assigning work at Gotham Applied Sciences. The summary shows 6 assessment records, of which 2 are active, 3 pending approvals, 5 open incidents and no high risk items.
Bruce opens the Pending Approvals widget to review the damaged extraction hose report and the goods-in chemical drum assessment. He uses Incidents to follow up the pedestrian and forklift near miss. The Pre-use Checks widget shows 11 overdue checks, so he opens View Pre-use Checks to see which equipment needs attention before work starts.
The summary identifies the work to review; the linked screens hold the assessment, investigation and inspection records.
Guides for each safety task
The dashboard is the entry point; these guides cover the work itself.
Risk assessments
- Create a risk assessment — start a new assessment and record its hazards.
- Score risk with the risk matrix — how likelihood and severity combine into a risk level.
- Use AI assistance in a risk assessment — draft hazards and controls with the built-in assistant.
- Submit and approve a risk assessment — send an assessment for sign-off and approve it.
- Review a risk assessment — schedule and complete periodic reviews.
Incidents
- Report a safety incident — record an event as it is discovered.
- Investigate a safety incident — work through the investigation and root cause.
- Approve a safety incident — sign off a completed investigation.
Equipment readiness
- Review asset readiness — see which machines are cleared, blocked, or running under an override.
- Review pre-use-check results — open completed checks to confirm an asset passed.
- Run a pre-use check — how an operator completes a check on a tablet.
Orientation
- Review the safety overview — a walkthrough of reading the dashboard.
Feature state and limitations
The Safety area is generally available; no part of the dashboard is in preview.
Safety incident and risk-assessment changes can start published workflows. Certified Safety Actions use the existing Safety process rather than adding a second process. For example, scheduling a risk-assessment review is automation of that assessment's normal review work; it does not create an unrelated workflow approval. The standard validation, permissions, assignments, and history still apply, and failures are recorded in the workflow run log.
- The dashboard is read-only. Every number on it is a summary. To change anything you open the linked screen — the dashboard itself creates nothing except through the New menu, which simply navigates you to the report or assessment screen.
- Everything is scoped to the current plant. The strip and widgets count only the entity you are signed in to. If a number looks wrong, confirm you are in the right plant before investigating further.
- Pre-use checks are shared with Audits. A pre-use check is recorded as an audit, so the Pre-use Checks widget and Asset Readiness reflect data that is also managed under the Audits area.
Troubleshooting
- The Safety section is missing from the navigation. Your role does not include the View safety permission for this plant. Ask an administrator to grant it, or to confirm you are signed in to the correct entity.
- The numbers look empty or wrong. Check the entity selector — the dashboard only counts the current plant. Switch to the plant you expect the data in, then reopen Safety → Home.
- A pending item will not clear. The count drops only once the item is approved, closed, or its check completed on the linked screen. Open the item from the Pending Approvals widget and finish the action there.
Dates and time zones
Incident, review, inspection, and expiry dates that represent whole days follow the owning plant's calendar in lists, dashboard widgets, and reminders. Reported, submitted, approved, and completed timestamps preserve their exact event moment.
Related guidance
- Improvement and compliance — the wider area that Safety, Quality, and Audits sit within.
- Review asset readiness — the machine-by-machine readiness view.
- Run a pre-use check — how a check is completed.
- Blocking pre-use checks in production — how a failed or missing check keeps a machine out of use.
Link quality and production records
How a production defect links to a quality issue, where you trace that link, and when a station rework closes the issue with a disposition and a note.
Review the safety overview
See plant safety at a glance: active risk assessments, pending approvals, open incidents, high-risk items, the risk matrix, and overdue pre-use checks.