Review parts performance
Read the Parts Performance dashboard to rank every part by output volume, first-pass yield, scrap, and movement over a chosen window, then drill into one part's weekly yield, top defects, and recent jobs.
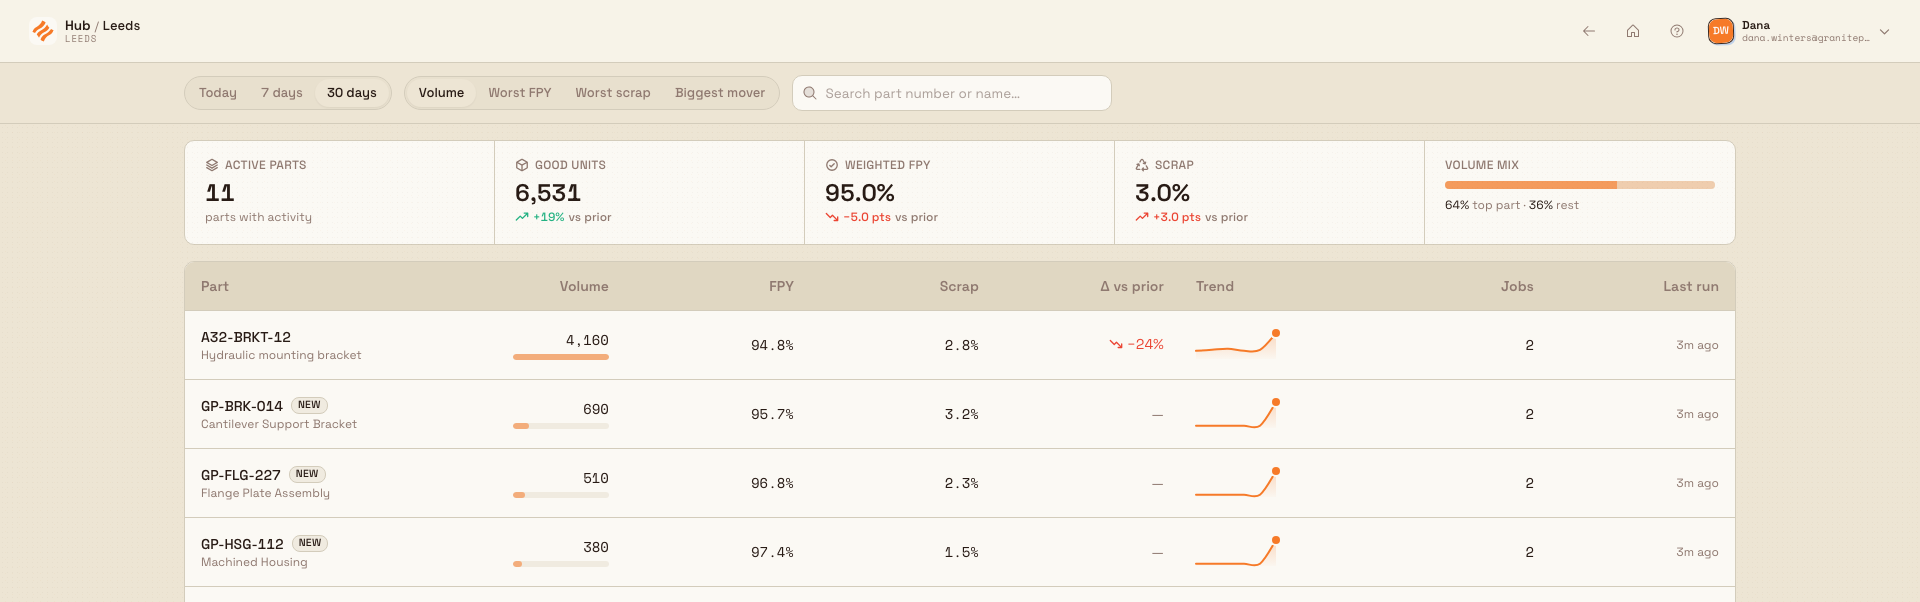
The Parts Performance dashboard ranks the parts your plant makes so you can see at a glance which ones run clean and which are fighting you. A part in Bulk is a distinct product or component you produce — usually identified by a part number and name. The board analyses every unit of output and every reject recorded against your production jobs over a window you choose, then lays the parts out as a leaderboard with the volume, yield, and scrap for each.
Two quality terms run through the whole board. First-pass yield (FPY) is the share of started units that came out good the first time — good units divided by started units, where started means good plus rejects. Scrap is the subset of rejects that were thrown away rather than reworked or accepted. A part with high volume, high FPY, and low scrap is running clean; a part with slipping FPY or climbing scrap is where your losses are.
Use Parts Performance when you want to know which parts to chase, not just how the plant did overall. It answers "which parts are winning, which are bleeding yield, and what is moving" — for a production review, a quality stand-up, or a quick check before you commit a run.
dashboards.parts-performance-01
Before you start
You need permission to view production data. The board reads the production.view permission — the same permission used across the Production module. Every built-in role that works with production carries it: Super user, Entity admin, Manager, Operator, Tablet user, Invoicing, Dashboards, and Master data. If your role lacks it, the board cannot load and shows an error in place of the leaderboard.
The numbers come entirely from recorded production. Good units are the output your operators book against a production job; rejects are the quality issues logged against that job, and a reject counts as scrap only when its disposition is set to scrap (rather than rework, concession, use-as-is, return-to-supplier, or pending). Each output and reject is traced to its part through the job it belongs to, so a part appears on the board only once work has been recorded for it. Cancelled jobs are ignored — their reversed output never ranks a part.
A part with no recorded work will not appear
Parts show up only after output or rejects are recorded against a job that carries that part. If a part is missing, confirm operators are booking output and logging quality issues on its jobs, and that you are looking at a window in which it ran.
Open the board
Parts Performance opens as its own full-screen page, separate from the main app sidebar:
- From the Home screen, open the Dashboards module tile to reach the picker at
/dashboards. - Find the Parts Performance card (code
DASH-PARTS) and open it. The board loads at/dashboards/parts-performance, full-width with no sidebar. - Use the Back to dashboards control in the top-right of the header to return to the picker.
The board's whole scope lives in the address, so any view you are looking at is a link you can share or bookmark. The time range is the range parameter, the sort is sort, an active search is q, and an open part drawer is part (with pw for the drawer's own range). Copy the address to hand a colleague the exact same board — same window, same sort, same part.
Set the scope
A sticky scope bar sits at the top of the board and controls what the leaderboard shows. It stays in view as you scroll.
- Time range — a segmented control with Today, 7 days, and 30 days. Today counts from the start of the current day; the 7- and 30-day options are rolling windows ending now. The choice sets both the metrics and the window that every delta compares against.
- Sort — a segmented control with Volume, Worst FPY, Worst scrap, and Biggest mover. This is a triage board, so every sort puts the parts that most need attention at the top: Worst FPY and Worst scrap surface the weakest parts first, and Biggest mover ranks by how much the sorted metric changed versus the previous window.
- Search part number or name… — type to narrow the leaderboard to matching parts; a clear (X) button resets it.
Snapshot-backed freshness
Parts Performance reads a complete analytics snapshot rather than loading production history into the live app request. A newly recorded output, reject, job, or part appears after its snapshot finishes, usually within seconds or a few minutes. The board refreshes when that happens and also checks every five minutes. If a temporary refresh fails, the last successful result stays visible instead of being replaced with an incomplete ranking.
Read the headline tiles
Above the leaderboard, five tiles roll up the whole window:
- Active parts — how many distinct parts recorded any output or rejects in the window.
- Good units — total good output across all parts, with a change versus the previous window of equal length.
- Weighted FPY — first-pass yield across the whole plant, weighted by volume (total good divided by total started), so a high-volume part counts more than a low-volume one. Its change is shown in percentage points, not a relative percentage.
- Scrap — scrap as a share of all started units, again with a points change versus the previous window.
- Volume mix — a bar splitting the largest single part's share of good units from the rest, so you can see how concentrated your output is.
A change is shown only when the previous window is comparable. When there is nothing to compare against, the tile shows an em dash (—) rather than a made-up figure.
Read the leaderboard
The leaderboard is the center of the board — one row per part, ranked by the sort you chose. Its columns are:
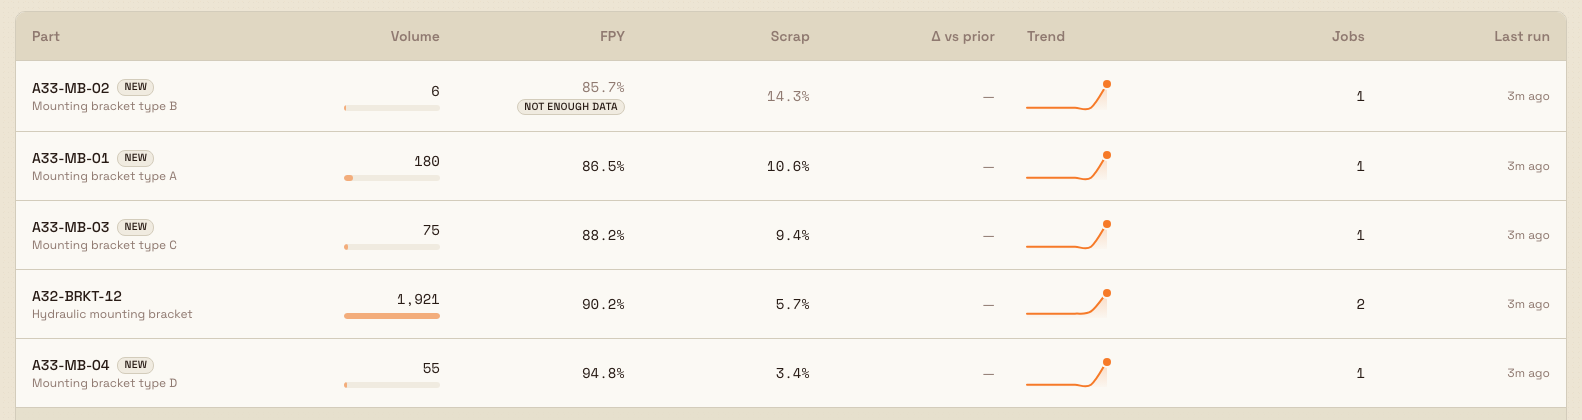
- Part — the part number and name. A part with no activity in the previous window is tagged New.
- Volume — good units in the window, with a proportional bar scaled against the largest part so you can compare at a glance.
- FPY — first-pass yield for the part.
- Scrap — scrap percentage for the part.
- Δ vs prior — how the sorted metric changed against the previous window, with an up or down arrow. This column follows the sort: with Volume selected it compares volume, with Worst FPY it compares FPY, and so on.
- Trend — a compact sparkline of the part's good-unit output across the window, oldest to newest.
- Jobs — the number of distinct production jobs that contributed in the window.
- Last run — how recently the part last recorded output, phrased in plain terms such as "3h ago" or "yesterday".
Two honesty flags keep small numbers from misleading you. A part with fewer than 10 started units in the window is marked Not enough data and its percentages are greyed — the sample is too small to trust. A percentage whose denominator is zero is never shown as a false 0% or 100%; it reads as an em dash.
dashboards.parts-performance-02
Drill into one part
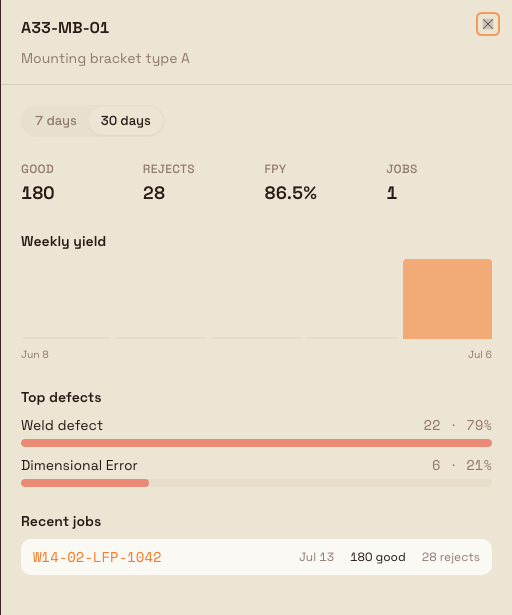
Select any row to open a detail drawer for that part on the right. Because the open part is written into the address (part), a drawer view is a link you can share. The drawer has its own 7 days / 30 days range toggle and shows:
- Totals — good units, rejects, FPY, and the number of jobs over the drawer's window. FPY is greyed when the sample is too small.
- Weekly yield — a bar per week of the window, so you can see whether yield is steady, improving, or slipping.
- Top defects — the part's reject categories ranked as a mini Pareto (the largest few, with each one's share of total rejects), so the biggest quality problem is obvious. Uncategorised rejects collapse into a single "Uncategorised" slice.
- Recent jobs — the most recent jobs for the part, each with its date, good quantity, and reject count, and each linking through to the full job record.
Close the drawer to return to the leaderboard exactly where you left it.
Example: Granite Peak Manufacturing
A production supervisor at Granite Peak Manufacturing's Leeds Fabrication Plant opens Parts Performance at the start of the afternoon to check the week. They set the range to 7 days and the sort to Worst scrap.
The top row is GP-4471 "Mounting bracket": about 1,240 good units from roughly 1,400 started, an FPY near 88.6%, and scrap around 8.6% — well above the handful of parts below it. The Δ vs prior arrow points down, so scrap is worse than the previous week. The supervisor selects the row.
In the drawer, the Weekly yield bars show FPY holding near 94% for the first weeks, then dropping to the mid-80s in the most recent one. Top defects is dominated by "Weld porosity" at roughly 62% of rejects, with "Dimensional" and "Surface finish" trailing. Recent jobs lists the runs that drove the dip; the supervisor follows the newest job link to see who ran it and on which asset. They now have a specific, evidence-backed item — porosity on the mounting bracket welds this week — to raise at the quality stand-up, instead of a vague sense that scrap is up.
What you can expect
For any window and any sort, Parts Performance gives you a truthful, per-part ranking of volume, first-pass yield, scrap, movement, jobs, and recency, plus plant-wide rollups on the tiles. Changing the range or sort recomputes every tile, every row, and every comparison for the new scope. Small samples and zero denominators are flagged rather than guessed, so the board never overstates what the data supports.
Limitations and feature state
- This dashboard is available — generally released, not a beta.
- It is read-only. It visualises production and quality data but does not let you change output, rejects, or jobs from here. Corrections are made where the data originates.
- The leaderboard shows up to the top 50 ranked parts. When more parts match, a footer reads "Showing the top n of x active parts · k more not shown" so you know the ranking is capped, not the whole picture.
- The board tracks volume, first-pass yield, and scrap. It does not currently show per-part cost or cycle time, even though the picker card's description mentions them.
- Percentages depend on recorded output and logged quality issues. A part whose operators book output but never log rejects will show a very high FPY simply because nothing was recorded against it.
- Scrap is a subset of rejects. A reject only counts toward scrap when its disposition is set to scrap; rework, concession, use-as-is, return-to-supplier, and pending rejects lower FPY but do not raise scrap.
- Every figure reflects the chosen window. Switching between Today, 7 days, and 30 days changes the totals, the deltas, and which parts appear — this is expected.
- Figures update after the latest analytics snapshot completes, so recently recorded production may take a few seconds or minutes to appear.
Verification note on search
The search box narrows the leaderboard to parts whose number or name matches your text; a non-matching search shows "No matching parts". The exact scope of the filter is confirmed during screenshot capture in the shared documentation environment.
Troubleshooting
- "No production in this window." No part recorded output or rejects for the selected range. Widen the range, confirm operators are recording work, and check the right plant is selected.
- "No matching parts." Your search text matches no part number or name in the current range. Clear the search with the X button to see the full leaderboard again.
- A part shows "Not enough data." Fewer than 10 units started for that part in the window, so its percentages are statistically shaky. Widen the range or wait for more runs before reading its FPY and scrap.
- A percentage or delta shows "—". There was no comparable figure — a zero denominator, or no previous window to compare against. This is deliberate, not an error.
- A recent output or reject is missing. Wait for the next analytics snapshot to finish. The board refreshes automatically and also checks every five minutes.
- The drawer says "Part not found." The link points to a part that has been removed or is out of date. Pick a part from the leaderboard instead.
- The leaderboard will not load. A persistent failure usually means your account lacks the
production.viewpermission — ask an administrator to grant a production-viewing role.
dashboards.parts-performance-03
Related guidance
- Dashboards — the full picker and the other built-in boards.
- Use Quality Watch — defects, scrap, and first-pass yield across the plant rather than per part.
- Review OEE assets — machine-level running, downtime, and effectiveness.
- Review OEE people — the same effectiveness lens applied to operators.
- Review production flow — where value and work-in-progress sit across the routing.
- Insights and visual management — the wider reporting and visual-management area.
Review Value Flow
Read the live Value Flow dashboard to see where work-in-progress money sits across your routings, stations, and machines — and which jobs to chase next.
Review downtime Pareto
Read the Downtime Pareto dashboard to rank stoppage reasons by lost time, find the vital few losses, and drill from a reason or machine down to individual downtime events.