Review production flow
Read the Value Flow dashboard to trace where the money in your work-in-progress sits across routings, steps, machines, and jobs, and see what to chase first.
The Value Flow dashboard turns your live work-in-progress into money and shows where that money is sitting right now — which routing, which step, which machine, and which jobs. In Bulk, work-in-progress (WIP) is every job that has started but has not yet been delivered, and a routing is the ordered set of steps a job travels through to be made. Value Flow prices each of those jobs in a single currency and lays them out so you can see where value is piling up and what to move next.
Use it when you want to steer by money rather than by machine state: at a production or planning huddle, when deciding what to expedite, or when a due date is at risk and you need to know how much value is behind it. Every number is live and read-only — Value Flow shows you where to act, then links you straight to the job, the schedule, or the station where you take that action.
Finding this board in the app
In the Dashboards picker this board is named Value Flow and tagged with the code DASH-FLOW. This page uses that name throughout. The board opens at the /dashboards/production-flow address.
Before you start
You need three things in place:
- The View production permission. Value Flow reads the
production.viewpermission (shown as View production in role settings — the same permission that opens the Production module). By default it is granted to the Super user, Entity admin, Manager, Operator, Tablet user, Invoicing, Dashboards, and Master data roles. Without it the board cannot load its data. - At least one routing with active work. Value Flow maps money across your routings. If the selected site has no routings, the board shows a "No routings defined" empty state with a Set up routings button. If routings exist but nothing is in progress for the chosen period, the map reads "Nothing in WIP for this window".
- Priced jobs in a convertible currency. Values come from each job's price, converted into one display currency for the whole board. Jobs with no price show as unvalued, and jobs whose currency has no conversion rate show as unconverted. Both are counted separately as honesty chips and are never folded into the money totals.
Open the board
- From the Home screen, open the Dashboards tile to reach the picker at
/dashboards. - In the Standard suite, find the Value Flow card (code DASH-FLOW). Single-click to select it and then choose View DASH-FLOW, or double-click the card to open it straight away.
- The board fills the screen with no sidebar. Use Back to dashboards at the top-right to return to the picker.
dashboards.production-flow-01
Choose your time window
The header holds a small set of controls that frame everything below:
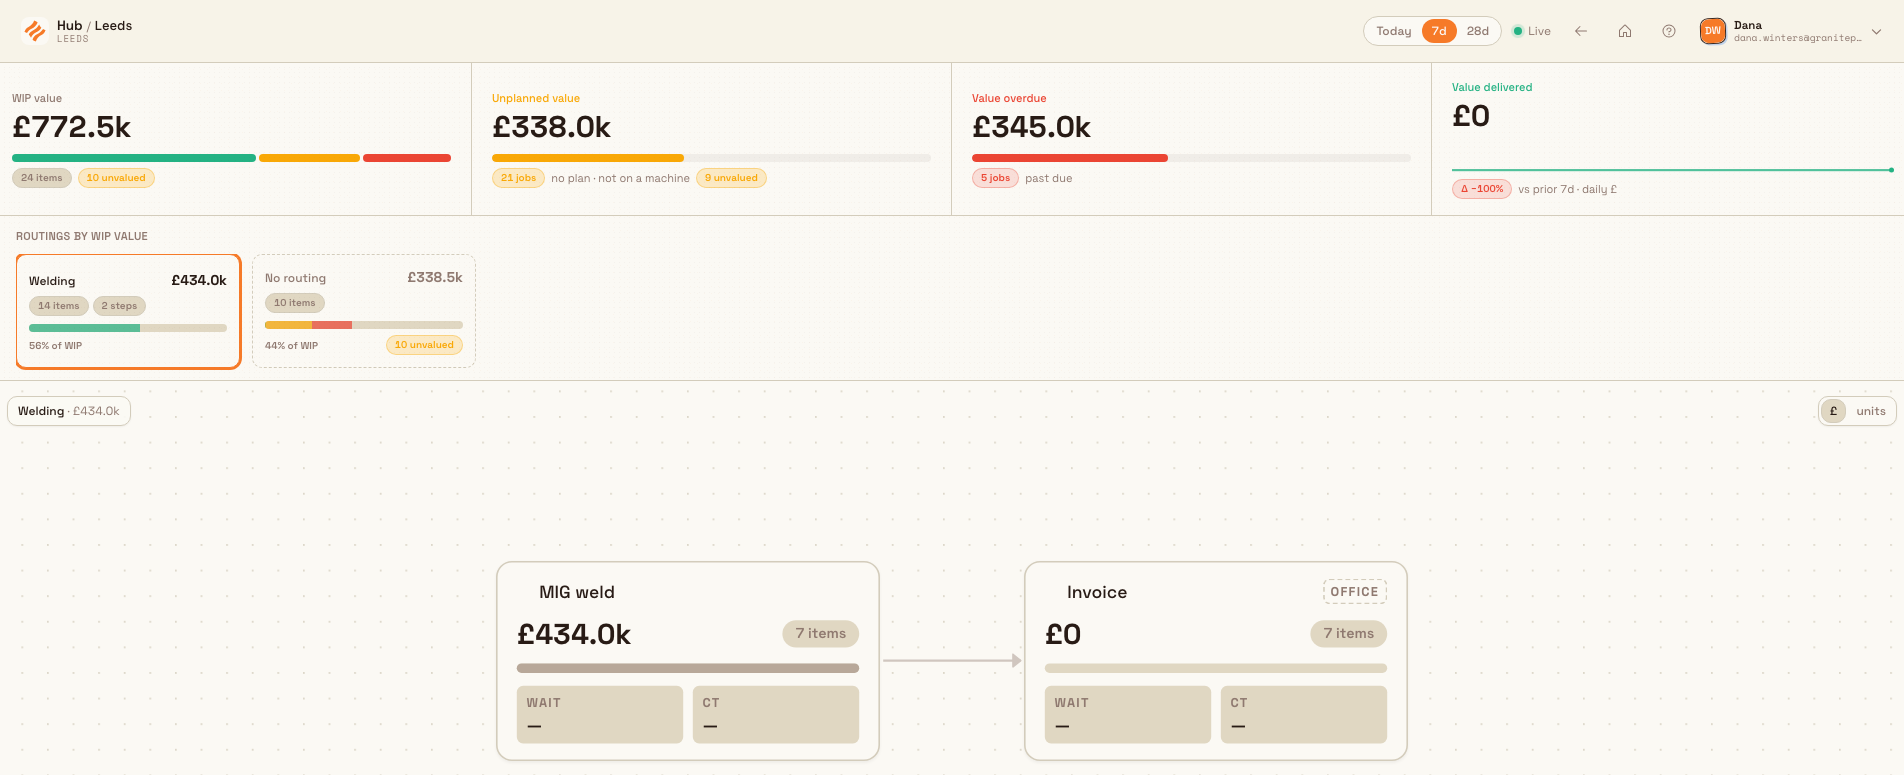
- A time-window pill with Today, 7d, and 28d (7d by default). It sets the period every tile, the map, and the aggregates report on.
- A Live indicator. The board is subscribed to production data and updates on its own as work moves.
- A Partial data badge that appears when a reading was too large to complete in full. Treat those numbers as a floor rather than an exact total.
The board reads one site at a time, and the site switcher is locked while you are inside it. Switch sites from the picker if you need another plant's numbers.
Read the board, top to bottom
Value Flow is laid out as a funnel, from the whole site down to a single machine.
The money headline
Four tiles across the top total the current scope:
- WIP value — the money tied up in work-in-progress right now. Its bar shows the age mix of that value: green for 0–7 days, amber for 7–30 days, and red for 30+ days in WIP. Selecting this tile scrolls you to the routing rail.
- Unplanned value — WIP value that has "no plan · not on a machine". Selecting it takes you to Scheduling to plan that work.
- Value overdue — WIP value that is "past due". Selecting it filters the rest of the board to overdue work, and selecting it again clears that filter.
- Value delivered — value delivered within the window, with a change figure against the prior equal-length period and a daily sparkline.
Each tile also carries honesty chips — for example "N items", "N unvalued", or "N unconverted" — so you can see how much sits outside the money figure.
The routing rail
Beneath the headline, Routings by WIP value lists one card per routing, largest value first. Each card shows the routing's value, its share ("N% of WIP"), and any unvalued count. Selecting a card loads that routing into the map below. Routings with no current WIP fold into an "N idle" card, and a trailing card ("Show all →") expands the full list. When you first open the board, the highest-WIP routing is selected for you.
The routing map
The centre of the board maps the selected routing as a flow of steps:
- A currency / units toggle at the top-right of the map swaps every number between the display currency and item counts.
- Each step node shows the station name, its money or item value, a bar sized against the busiest step, and two median-time tiles: Wait (how long work waits before the step) and CT, the cycle time through it. Live asset dots show the machines at that step as running, paused, or idle.
- The step holding the most queued value is flagged Bottleneck.
- A backlog node collects work that has not started, with a Plan → action into Scheduling.
- Curved rework edges show where work loops back, labelled with the rework percentage.
- A scope label names the routing and its total, and notes any "jobs at steps off this map".
If a routing has no steps you see "No steps on this routing". If nothing is in WIP for the window, the map reads "Every routing is idle — the map appears when work starts moving."
The step panel
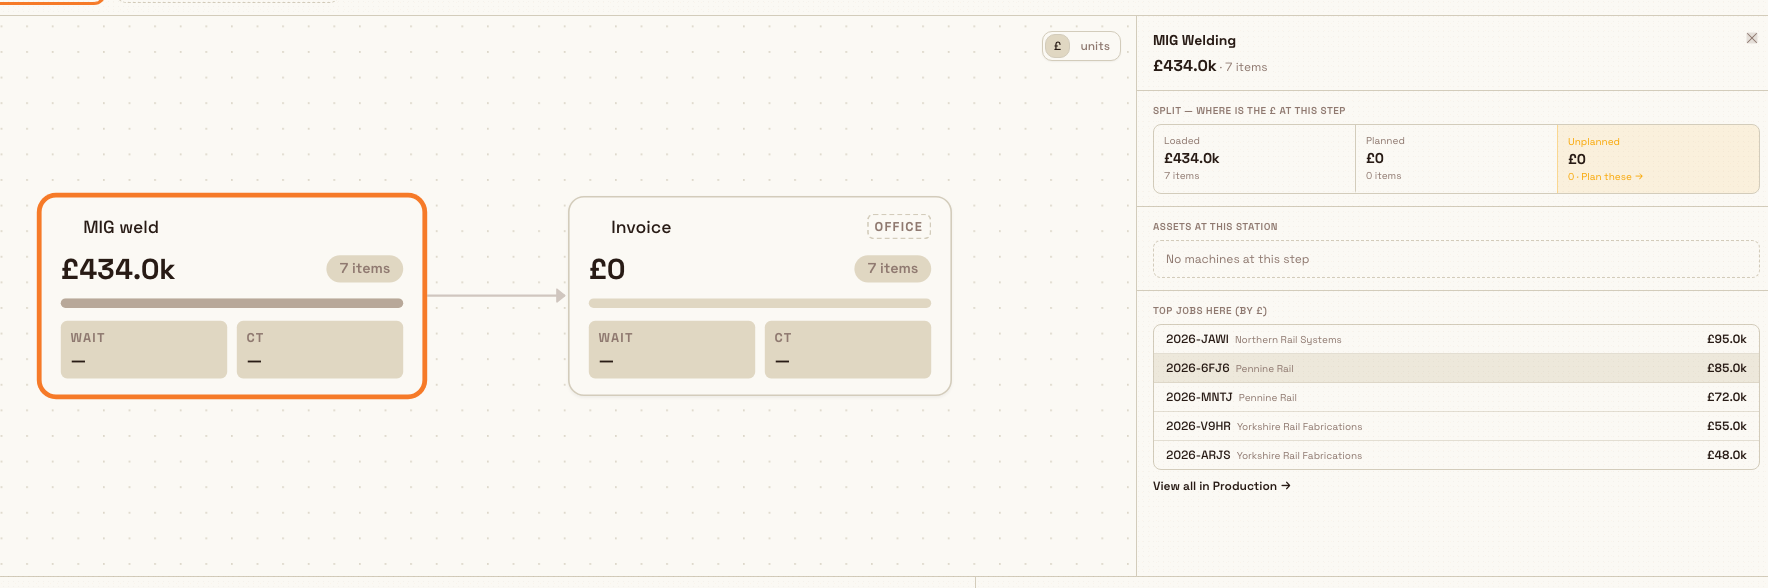
Select a step to open a panel beside the map:
- Split — where is the £ at this step breaks the step's value into Loaded (on a machine), Planned (scheduled but not yet loaded), and Unplanned (neither), with a Plan these → shortcut on the unplanned amount. The £ shown is your display currency's symbol.
- Assets at this station lists the machines at the step. Select one to open the asset panel.
- Evidence summarises the window: the oldest waiting jobs, first-pass yield (FPY, the share of output that passes quality the first time), scrap, and availability, plus a note when the step is the routing's bottleneck.
- Top jobs here ranks the jobs carrying the most value at that step. Select one to open the job.
dashboards.production-flow-02
The asset panel
Select a machine to drill one level deeper:
- Its live state and how long it has held it, the value and item count loaded on it, and the current operator.
- An open-downtime band when a stoppage is running, showing the reason, how long it has been open, and availability today.
- Today on this asset — touch time from timers, output units and completed value, and a run/pause pattern strip.
- Loaded jobs — the jobs on the machine, each marked Running or Queued on asset. Select one to open it.
Worth attention, and where the value sits
The bottom band turns the whole picture into a short, ranked to-do list:
- Worth attention ranks the top jobs by value at stake for the current scope. Each card carries server-computed reason chips (for example late, due, or unplanned) and a due date. Select a card to open the job, or use "View all N in Production →" for the full list. When there is nothing to chase, the strip reads "Nothing needs chasing in this scope — flow is healthy."
- Where the value sits aggregates the same scope three ways: By age in WIP (0–7d / 7–30d / 30d+), By due status (Overdue / Due this week / On track), and Top customers. Selecting any segment filters the Worth-attention list to that slice, and selecting it again clears it.
Because the board keeps your selected routing, step, machine, window, and filter in the page address, you can copy the link and share the exact view with a colleague.

dashboards.production-flow-03
Example: Granite Peak Manufacturing
Before the 9 a.m. planning huddle at Granite Peak Manufacturing's Leeds Fabrication Plant, the operations lead opens Dashboards and selects the Value Flow card, leaving the window on 7d. The headline shows WIP value of about £142k with a wide red band on the age bar — a chunk has been in progress for more than 30 days — alongside £28k of Value overdue. The lead selects Value overdue to filter the whole board to late work.
The routing rail puts CNC Machining at the top by WIP value. Selecting its card draws the map, and a Bottleneck flag sits on the Deburr step, whose Wait tile shows work queuing far longer than its cycle time. The lead selects Deburr; the step panel's Split shows most of that value is Unplanned, so they use Plan these → to jump to Scheduling and load the work. In Worth attention, the top card is job GPM-4471 for a key customer, flagged late and unplanned, and the lead opens it to confirm the promise date. Finally, Where the value sits → Top customers shows a single customer holds roughly a third of the overdue value — the headline the lead takes into the huddle. No figure was typed or added up by hand; the board did the sums and pointed at the work.
What you can expect
For any window and any routing, Value Flow gives you a single-currency, live decomposition of where WIP value sits — by routing, step, machine, age, due status, and customer — and a ranked, reason-tagged list of the jobs worth chasing. Changing the window, or the selected routing, step, machine, or filter, recomputes every figure for that new scope.
Limitations and feature state
- Value Flow is available (generally released), not a beta.
- It is read-only. It shows where value sits and links you to the job, schedule, or station to act — it does not change plans or prices itself.
- Figures are money-first and single-currency. Every value is converted into one display currency. Jobs with no price ("unvalued") and jobs whose currency has no conversion rate ("unconverted") are reported separately and never counted in the money totals, so a total can understate reality when those counts are high.
- Numbers always reflect the selected scope and window. Switching routing, step, machine, filter, or window changes the totals, which is expected.
- A Partial data badge means a reading was truncated; treat the affected numbers as a lower bound.
- In the app this board is named Value Flow (code DASH-FLOW). The route slug
production-flowand this page's title keep the older "production flow" name for the same board.
Troubleshooting
- "No routings defined." The site has no routings yet. Select Set up routings, define at least one routing, then reopen the board.
- "Nothing in WIP for this window" or "Every routing is idle". Nothing is in progress for the chosen period. Widen the window to 7d or 28d, or confirm that jobs are actually running at this site.
- A tile or step reads much lower than expected. Check the unvalued and unconverted chips — value with no price, or no conversion rate for its currency, is excluded. Add prices, or a conversion rate for that currency, where the data originates.
- The board shows "Something went wrong". A shared link can point at a routing, step, or machine that has since been deleted. Choose Try again, or go back to the picker and reopen the board — it falls back to the default highest-WIP view. A persistent failure usually means your role lacks the View production permission; ask an administrator to grant it.
- A machine shows no live state or output. That asset logged no timer activity or open event in the window. Confirm operators are running production timers on it.
Related
- Dashboards — the full-screen picker this board opens from.
- Review downtime Pareto, Use Quality Watch, and Review parts performance — the other value-and-quality boards in the standard suite.
- Review OEE people and Review OEE assets — effectiveness by operator and by machine.
- Scheduling and the planning board — where the Plan actions on unplanned value take you.
- Set up routings and edit a routing — define the steps this board maps value across.
- Run production timers — the touch time and live states the asset panel reads.
- Orders and jobs — where a selected job card opens.
Use Quality Watch
Open the Quality Watch dashboard to track first-pass yield against target, see which defect categories or parts drive the most rejects, and drill into the underlying defect log for one site.
Review Value Flow
Read the live Value Flow dashboard to see where work-in-progress money sits across your routings, stations, and machines — and which jobs to chase next.