Use Quality Watch
Open the Quality Watch dashboard to track first-pass yield against target, see which defect categories or parts drive the most rejects, and drill into the underlying defect log for one site.
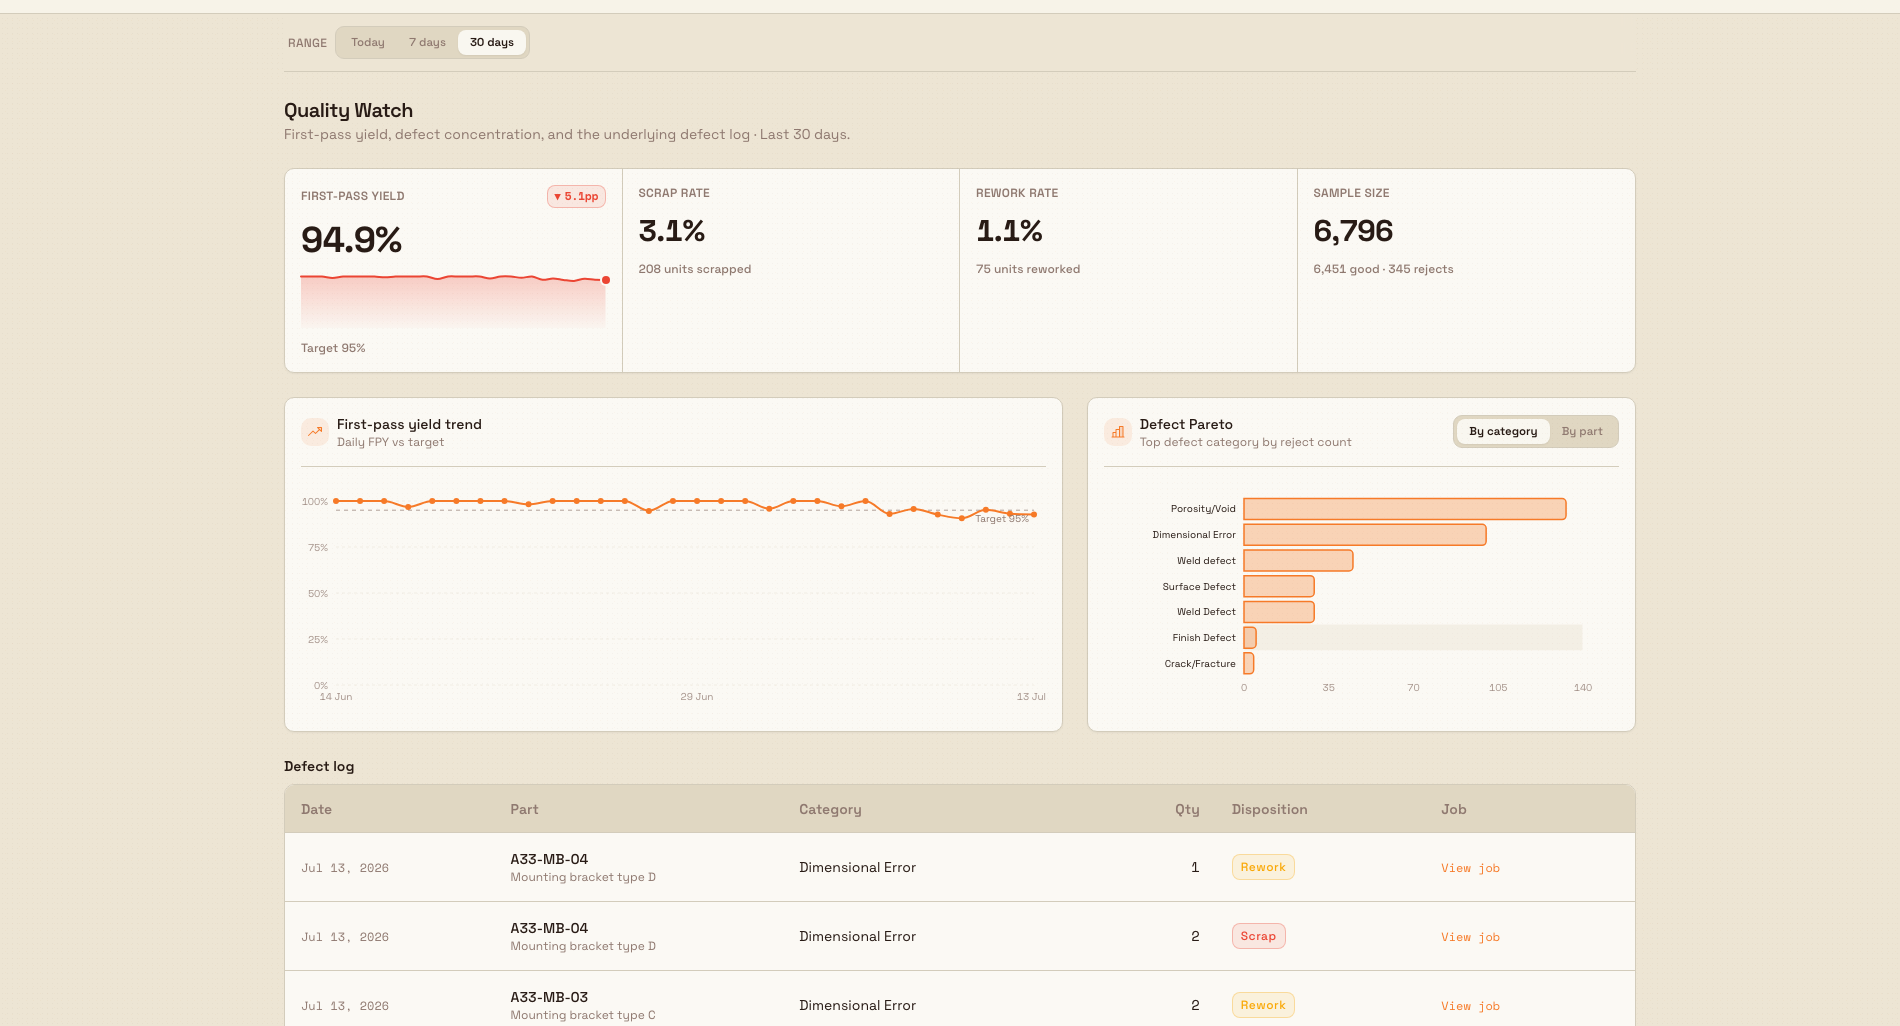
Quality Watch is the built-in dashboard for reading quality performance on one site. It answers three questions in one screen: how good your output is right now (first-pass yield), where the rejects are concentrated (by defect category or by part), and what each of those rejects actually was (the defect log). First-pass yield, or FPY, is the share of production that passed inspection the first time, without needing scrap or rework — so a higher FPY means less waste and less firefighting.
Use Quality Watch when you want to understand quality rather than log it: in a daily quality stand-up, when yield dips and you need to find the cause, or when you are deciding which part or defect type to tackle first. Every number is computed for the one site you have selected and for the time range you choose, and clicking a defect bar filters the whole page to that cause — so you move from "yield is down" to "it is this part, these dispositions, these jobs" without leaving the page.
dashboards.quality-watch-01
Before you start
You need the View quality dashboard permission (quality_dashboard.view) for the site you want to read. By default this permission is held by three roles:
- Super user
- Entity admin
- Quality
The general-purpose Dashboards role and the Manager role can open the Dashboards picker and the OEE boards, but they do not include the quality dashboard permission — so they can see the Quality Watch card yet cannot load the board. If Quality Watch fails to load for you, this permission is the first thing to check with an administrator.
The numbers come from production activity on the selected site, so they are only as complete as your shop-floor records:
- Good units are the non-inspection quantities operators record as production output.
- Rejects are the quantities logged as quality issues during production, each with a disposition (what happened to the reject — for example scrap or rework) and, where known, a defect category and the job it came from.
If your operators do not record output and rejects, the tiles show a neutral em-dash ("—") rather than a misleading zero, and the charts read "No production recorded in this scope."
Open the dashboard
Quality Watch opens as its own full-screen page, separate from the main app chrome:
- From the Home screen, open the Dashboards module tile to reach the picker at
/dashboards. - Find the Quality Watch card (code
DASH-QC, described as "Catch defects, scrap and yield slipping before they hit the customer"). Select it to open the board at/dashboards/quality-watch. - The page fills the width with no left sidebar. A back arrow in the top-right (labelled Back to dashboards) returns you to the picker.
For more on the picker itself — selecting versus opening a card, opening a board in a new window, and filtering the suite — see Dashboards.
Set the scope
A sticky scope bar runs across the top of the page and controls what every tile, chart, and the log below react to.
Choose the time range. Next to the Range label, a segmented control offers Today, 7 days, and 30 days. The board opens on 30 days. Whichever you pick becomes the window for every number on the page, and the subtitle under the title echoes it back (for example, "Last 30 days") so the labels cannot drift from the data.
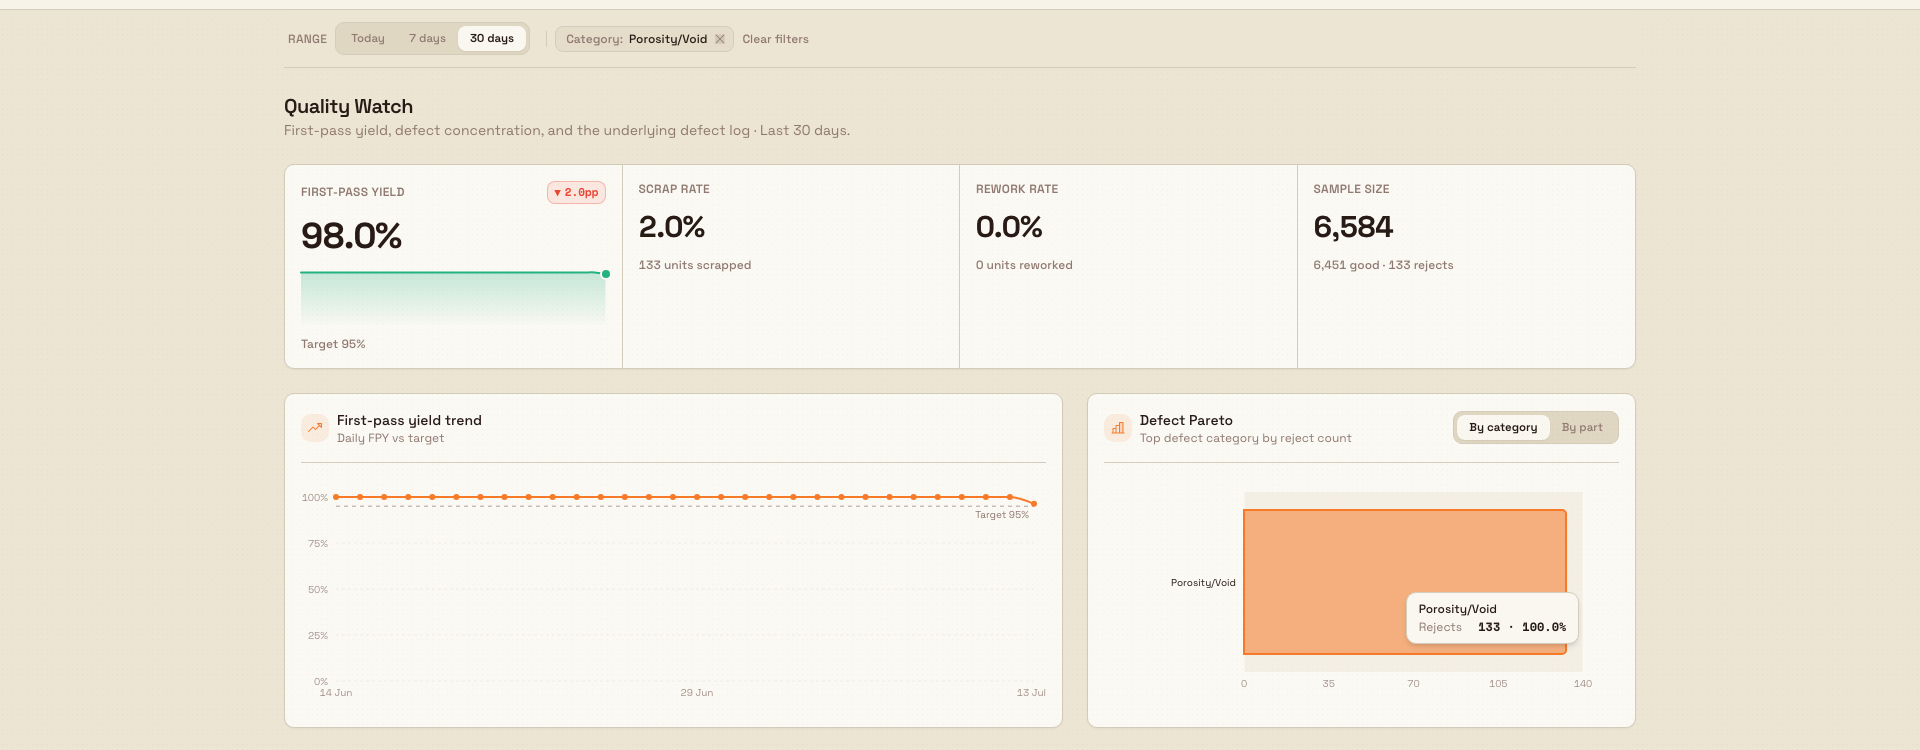
See and clear active filters. When you narrow the page — by clicking a Pareto bar, or by opening a shared link that already carries a filter — the scope bar shows a removable chip for each active filter: Category, Part, or Disposition, each with its resolved name (for example, Category: Surface finish). Select a chip's × to remove that one filter, or select Clear filters to remove them all at once.
Watch for partial data. On very high-volume windows the board reads only the most recent records rather than blowing its data limit. When that happens, a Partial data marker appears at the right of the scope bar and the defect log notes "Showing most recent · partial data". The current picture stays accurate; the trend comparison against the prior period is set aside so it is never computed on incomplete data.
Read the yield tiles
A row of four tiles summarises the window:
- First-pass yield — the hero number: good units as a percentage of all units. When a comparable prior window exists, a delta shows the change in percentage points ("pp"), a small FPY trend sparkline shows the shape, and the tile notes the target ("Target 95%" by default, the standard first-pass-yield goal). The value turns green when it meets or beats the target and red when it falls short — but only once the sample is large enough to trust.
- Scrap rate — the share of the window's units that were scrapped, with the count beneath ("N units scrapped").
- Rework rate — the share of the window's units sent back for rework, with the count beneath ("N units reworked").
- Sample size — the total units counted for the window, split beneath as "N good · N rejects".
Quality Watch is deliberately honest about thin data. When fewer than 20 units were produced in the window, it treats the sample as too small to judge: it mutes the yield colouring and flags the count as "low sample n=N" so a single reject in a near-empty window does not light up the board red.
Read the trend and the Pareto
Below the tiles, two cards sit side by side.
First-pass yield trend plots daily FPY as a line against the target reference line, with the caption "Daily FPY vs target". Days with no production render as gaps in the line rather than a dishonest 0%. Hover any point to read that day's FPY, its good-versus-rejects split, and the target. If nothing was produced in the range, the card reads "No production recorded in this scope."
Defect Pareto ranks where the rejects are coming from, tallest bar first, so you can see the vital few causes at a glance. A segmented control switches the grouping:
- By category — rejects grouped by defect category (the reason the reject was logged under). The subtitle reads "Top defect category by reject count".
- By part — rejects grouped by the part being made. The subtitle reads "Top part by reject count".
The chart keeps the top eight groups and rolls the remainder into a single "Other (n)" bar. Hover a bar to read its reject count and its share of all rejects.
Cross-filter by clicking a bar. Selecting a real bar (not the "Other" rollup) narrows the whole page to that cause: a Category or Part chip appears in the scope bar, and the tiles, trend, and defect log all recompute for the selection. The active bar stays emphasised so you can see what you have drilled into. Remove the chip to return to the full picture.
dashboards.quality-watch-02
Read the defect log
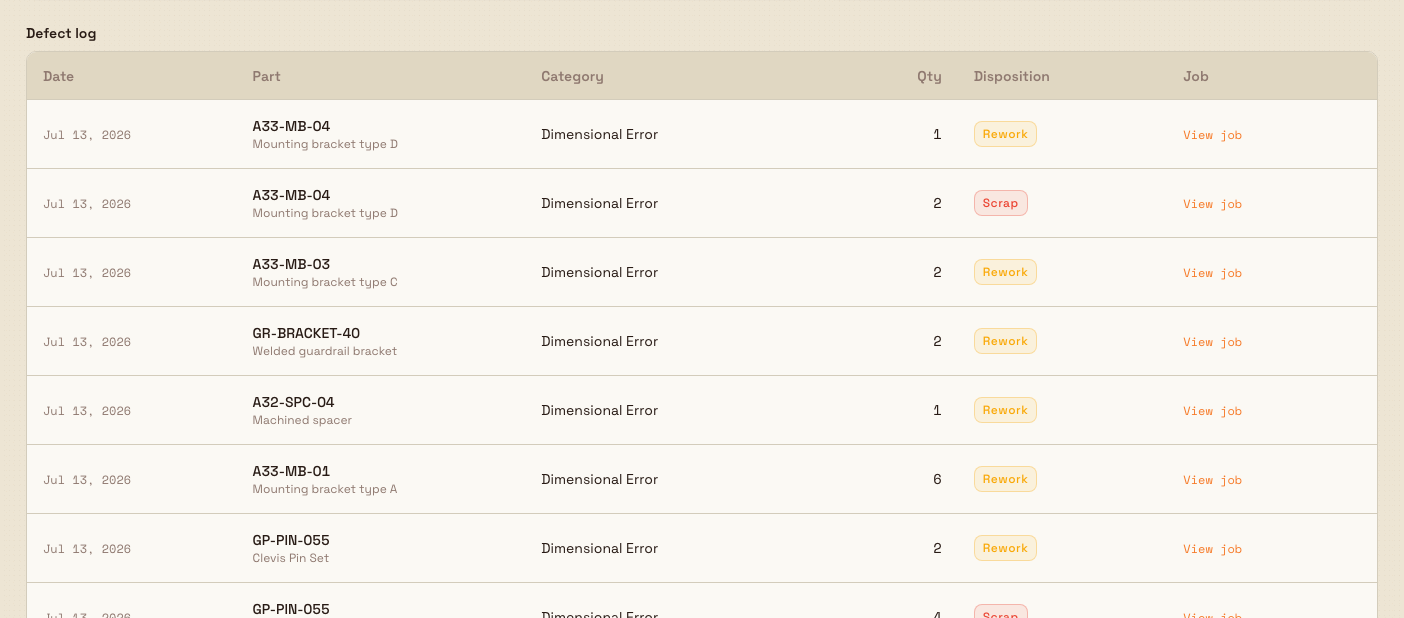
The Defect log at the foot of the page is the raw evidence behind the charts — one row per recorded reject, newest first, always reflecting the same scope and filters as everything above. Each row shows:
- Date — when the reject was recorded.
- Part — the part number and name, or "—" when no part is linked.
- Category — the defect category, or "Uncategorized".
- Qty — the number of units in that reject.
- Disposition — a coloured chip: Scrap and Rework carry the strongest tone, and Concession, Use as is, Return to supplier, and Pending are also possible.
- Job — a View job link to the production job the reject came from, where one is linked.
When the scope holds no rejects, the log shows a green, reassuring empty state — "No defects in this scope" — rather than an alarming blank. The log shows the most recent rejects up to its display limit; on a very busy window it notes "Showing most recent · partial data".
The defect log also honours a disposition filter
The Category and Part filters are set by clicking Pareto bars. A Disposition filter (for example, Scrap or Rework) narrows the log too, but it is applied from a shared or hand-built link — for example one ending ?disposition=scrap — rather than from an on-page control. However it arrives, it shows as a removable chip in the scope bar, so you clear it the same way.
Example: Granite Peak Manufacturing
At Granite Peak Manufacturing's Leeds Fabrication Plant, the quality lead runs a short yield review every morning. They open the Dashboards tile, open Quality Watch, and leave the Range on 30 days for the monthly picture.
The First-pass yield tile reads 93.1%, a touch under the 95% target, with a down delta of 1.4 pp against the previous month — enough to look into. The Scrap rate tile shows 2.2% with 118 units scrapped. In the Defect Pareto, "Surface finish" is by far the tallest bar at 41% of rejects. The lead clicks it; a Category: Surface finish chip appears and the whole page narrows. The FPY trend now shows the surface-finish drag concentrated in the last ten days, and switching the Pareto to By part reveals that one part — bracket GP-4400 — accounts for most of it.
Scrolling to the Defect log, the lead sees a run of surface-finish rejects on GP-4400, most dispositioned Rework, each linked to a job. They select View job on the newest one to open it and check the routing and operator, and take a concrete, evidenced item to the improvement huddle: surface finish on GP-4400, rework-heavy, trending worse this week — rather than a vague "yield is down".
dashboards.quality-watch-03
What to expect
For any site, any time range, and any filter you set, Quality Watch gives you a consistent chain: a first-pass-yield score against target, a trend of how it moved day by day, a Pareto of which categories or parts drive the rejects, and the exact reject records behind them — all scoped to the same window and filters at once. Changing the range or clicking a Pareto bar recomputes every tile, the trend, and the log together, so what you read always describes the same slice of production.
Limitations and feature state
- Quality Watch is available (generally released), not a beta.
- It is read-only. You investigate quality here but do not record or edit rejects, dispositions, or targets from this page — corrections are made where the data originates, in production and in the quality module.
- Every number is scoped to the one site you have selected and to the chosen time range. Switch sites first if you need another plant's numbers.
- The time range is fixed to Today, 7 days, or 30 days; there is no custom date picker on this board.
- The first-pass-yield target on this page is the standard 95%; it is not adjustable from the board.
- Completeness depends on shop-floor records. Units with no recorded output or rejects do not appear, rejects with no linked job show no View job link, and rejects with no category group under "Uncategorized".
- Only the Category and Part filters can be set by clicking; the Disposition filter is applied through a shared or hand-built link, not an on-page control.
- On very high-volume windows the board reads the most recent records only and shows a Partial data marker; in that case the prior-period comparison on the yield tile is withheld rather than computed on incomplete data.
Troubleshooting
- The board will not load, or shows an error. Your role most likely lacks the View quality dashboard permission for this site. Ask an administrator to grant it or to add you to the Quality, Entity admin, or Super user role.
- The tiles show em-dashes and the charts say "No production recorded in this scope." No output or rejects were recorded for the selected range. Widen the Range, confirm you are on the right site, and check that operators are recording production output and quality rejects.
- First-pass yield is muted and flagged "low sample". Fewer than 20 units were produced in the window, so the board will not colour the yield as pass or fail. Widen the range until the sample is large enough to judge.
- A "Partial data" marker appears. The window is very high volume, so only the most recent records were read and the prior-period delta is withheld. Narrow the Range (for example to 7 days or Today) for a complete, comparable read.
- A reject has no part, category, or job. That reject was recorded without those links. Fix it where it was recorded; the log reflects whatever the source record holds.
Related guidance
- Dashboards — the picker that opens Quality Watch and the rest of the built-in boards.
- Review parts performance — rank parts by cycle time, yield, and cost, complementing the Pareto's By part view.
- Review OEE people and Review downtime Pareto — the effectiveness and downtime boards in the same suite.
- Record output and Complete quality steps — where the good units and rejects on this dashboard are captured.
- Create a quality issue and Quality — logging and resolving the quality problems behind the numbers.
- Manage quality categories and root causes — define the defect categories that drive the By category Pareto.
Review OEE assets
Read the OEE Assets dashboard to see each machine's running, downtime, and inactive time, per-asset OEE, attached-sensor activity, and output for a chosen day — and correct recent entries when you have edit rights.
Review production flow
Read the Value Flow dashboard to trace where the money in your work-in-progress sits across routings, steps, machines, and jobs, and see what to chase first.