Score risk with the risk matrix
Understand Bulk's 5x5 likelihood-by-severity risk matrix, score a hazard's initial and residual risk inside a control measure, and read where an assessment lands on the Risk Matrix.
A risk matrix rates a hazard by combining two things: how likely it is to happen (likelihood) and how badly it could hurt someone (severity). Bulk uses a 5x5 matrix — likelihood from 1 to 5, severity from 1 to 5 — and multiplies the two to give a risk score from 1 to 25. That score maps to a risk level you can act on, from Very Low up to Critical.
You score risk whenever you assess a hazard: once for the raw hazard before any safeguards (initial risk), and again for what remains once your controls are in place (residual risk). The gap between the two shows how much your controls actually reduce the danger. Scoring the same way every time lets you compare hazards across the plant, prioritise the worst ones, and prove to an auditor that a risk was rated with a consistent method.
Scoring happens inside a control measure
You do not score risk on its own. Each score belongs to a control measure — a documented hazard, who it affects, and the controls that manage it — inside a risk assessment. This page explains the scoring model and the Risk Matrix view. To create the assessment those measures live in, see Create a risk assessment.
Before you start
Two permissions are involved, and in the default role set both are held by the Super user, Entity Admin, Manager, and Safety roles:
- Score a hazard (add or edit a control measure) needs the Create assessment permission (
safety.create_assessment). - View the Risk Matrix and open assessments needs the View safety permission (
safety.view).
You can only score risk while the assessment is editable — that is, while it is a Draft (or a Refused assessment you are correcting). Once an assessment is submitted for approval, active, or archived, its scores are locked into that version. To change a score on an active assessment you start a new revision. See Submit and approve a risk assessment.
How Bulk scores risk
The risk score is always likelihood times severity. Bulk provides fixed 1-to-5 scales for each so every assessor rates hazards the same way.
Likelihood — how probable the harm is:
| Value | Label | Meaning |
|---|---|---|
| 1 | Rare | May occur only in exceptional circumstances |
| 2 | Unlikely | Could occur at some time |
| 3 | Possible | Might occur at some time |
| 4 | Likely | Will probably occur |
| 5 | Almost Certain | Expected in most circumstances |
Severity — how serious the harm would be:
| Value | Label | Meaning |
|---|---|---|
| 1 | Insignificant | No injury or minimal impact |
| 2 | Minor | First aid treatment |
| 3 | Moderate | Medical treatment required |
| 4 | Major | Extensive injuries or hospitalisation |
| 5 | Catastrophic | Death or permanent disability |
Multiply the two and Bulk sorts the result into one of five risk levels, shown on a colour-coded scale from green through to red:
| Risk level | Score range | What it means |
|---|---|---|
| Very Low | 1–4 | Acceptable risk level |
| Low | 5–9 | Manage by routine procedures |
| Medium | 10–14 | Management responsibility |
| High | 15–19 | Senior management attention needed |
| Critical | 20–25 | Immediate action required |
For example, a hazard rated Likelihood 4 (Likely) and Severity 4 (Major) scores 16, which is High. Add controls that cut the likelihood to 2 (Unlikely) and the score drops to 8, which is Low.
Score a hazard: initial and residual risk
You score risk inside the Add Control Measure wizard. Open a Draft risk assessment, go to its Measures tab (the Control Measures section), and select Add Measure. The wizard has three steps; scoring is Step 2.
- Identify Hazard — enter the Hazard, a Task/Activity Description, and one or more entries under Who is at Risk? (for example Employees, Visitors, Contractors).
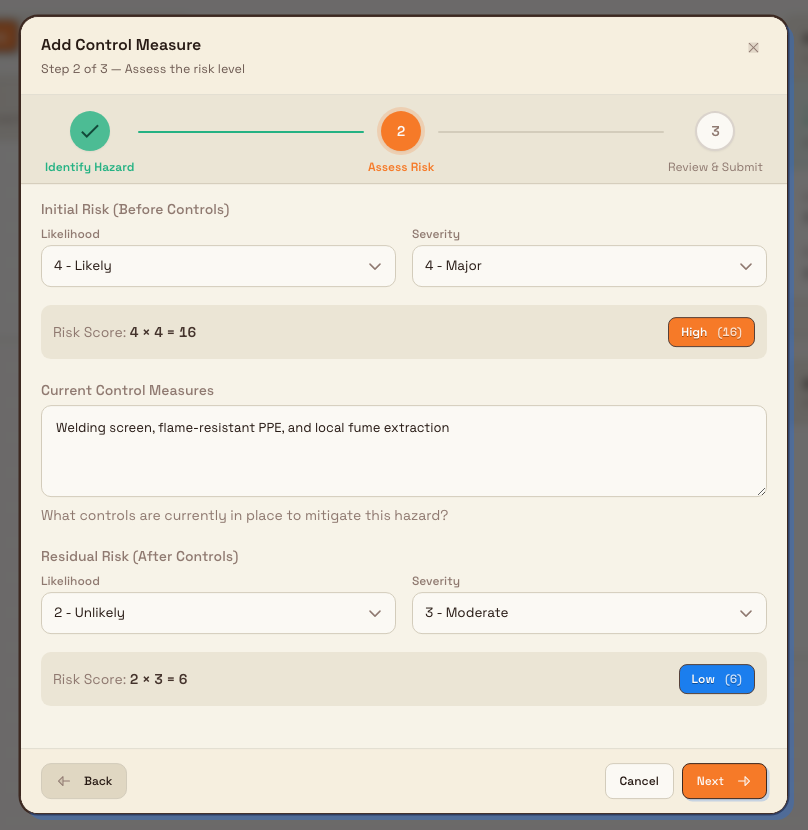
- Assess Risk — this is where you score. It has two scores, described below, with a Current Control Measures field between them.
- Review & Submit — add any Additional Controls Required and check the summary, which shows the initial and residual risk side by side, then select Add Measure to save.
On the Assess Risk step, each score uses the same control: a Likelihood dropdown and a Severity dropdown, each listing the 1-to-5 scale with its label. As you choose, Bulk shows a live preview — for example Risk Score: 4 × 4 = 16 — and a coloured badge naming the risk level.
safety.score-risk-01
- Initial Risk (Before Controls) — score the hazard as if no safeguards existed. This is the raw danger.
- Current Control Measures — describe the safeguards already in place (guards, PPE, procedures, training).
- Residual Risk (After Controls) — score the same hazard again, now that those controls apply. It should normally be lower than the initial risk.
Both scores are required, and each must be a whole number from 1 to 5 on both scales.
Where the score appears
Each measure you add shows its Initial Risk and Residual Risk as coloured bars in the Control Measures list, so you can see the reduction at a glance.
The assessment as a whole also gets a single headline score, shown in the Risk Summary card on the assessment's detail page. Bulk derives it from the worst residual risk across all of the assessment's measures — the measure with the highest residual score sets the assessment's likelihood and severity. The card shows that score out of 25, the risk-level badge, the likelihood and severity breakdown with their labels, and the formula, for example 2 × 3 = 6.
Screenshot placeholder
No asset at /docs/en/safety.score-risk/safety.score-risk-02.png yet
- Caption
- The Risk Summary card shows the assessment's headline score, taken from its worst residual-risk measure.
- Framing
- The Risk Summary card only: the hero score out of 25 with its badge, the Likelihood and Severity rows with segment bars, and the formula line at the bottom. Desktop width.
- Product state
- The Risk Summary card in the right sidebar of a risk assessment detail page, showing the overall score out of 25, a risk-level badge, the Likelihood and Severity breakdown with their scale labels, and the likelihood-times-severity formula.
- Setup
- Open a risk assessment that has at least two control measures with different residual scores, so the headline score clearly comes from the worst one. Navigate to Safety, Risk Assessments, then open the assessment. The Risk Summary card sits in the right-hand column.
safety.score-risk-02
Because the headline score comes from residual risk, a brand-new assessment with no measures yet sits at the lowest score (1 x 1, Very Low) until you add at least one measure.
Read the Risk Matrix
The Risk Matrix page plots every assessment on the 5x5 grid so you can see where your risk is concentrated. Open the Safety module in the left sidebar and select Risk Matrix (/safety/risk-matrix).
The page has two parts:
- Risk Overview — the colour-coded 5x5 grid. Columns are Likelihood (1 to 5), rows are Severity (5 down to 1). Each assessment is placed in the cell matching its headline likelihood and severity, and the number inside a cell is how many assessments sit there. Hover any cell for its label, score, and count.
- Risk Distribution and Assessments — a breakdown of how many assessments fall into each risk level, and a panel that lists the assessments in whichever cell you select. Select a cell to fill the panel, then select an assessment to open it.
A status filter at the top right controls which assessments are counted; it defaults to Active only, and you can switch it to All statuses, Draft, Pending Approval, Refused, or Archived.
Screenshot placeholder
No asset at /docs/en/safety.score-risk/safety.score-risk-03.png yet
- Caption
- The Risk Matrix plots each assessment by its headline likelihood and severity; select a cell to list the assessments there.
- Framing
- The full Risk Matrix page: the Risk Overview grid on the left, and the Risk Distribution and Assessments cards on the right. Desktop width so both columns are visible.
- Product state
- The Risk Matrix page at /safety/risk-matrix with the status filter on Active only, showing the colour-coded 5x5 Risk Overview grid with assessment counts in several cells, the Risk Distribution breakdown by risk level, and the Assessments panel.
- Setup
- Sign in to the Leeds Fabrication Plant entity with the View safety permission. Ensure several active risk assessments exist with a spread of scores so multiple matrix cells show non-zero counts. Navigate to Safety, then Risk Matrix. Optionally select one populated cell so the Assessments panel lists the assessments mapped there.
safety.score-risk-03
Example: Granite Peak Manufacturing
At Granite Peak Manufacturing's Leeds Fabrication Plant, the safety lead builds a risk assessment for operating the plasma cutting station and adds a control measure for the hazard "Molten metal spatter and UV arc exposure". The task activity is manual plasma cutting of steel plate, and the people at risk are the operator and nearby staff.
Before controls, the hazard is rated Likelihood 4 (Likely) and Severity 4 (Major) — a score of 16, which Bulk flags as High. The current controls are a welding screen, flame-resistant PPE, and local fume extraction. With those in place, the residual risk is rated Likelihood 2 (Unlikely) and Severity 3 (Moderate) — a score of 6, which is Low.
The assessment also has a second measure for a trip hazard whose residual risk scores 4 (Very Low). Because 6 is the worst residual score of the two, the Risk Summary card shows the assessment's headline score as 6 (Low), and on the Risk Matrix the assessment appears in the cell at Likelihood 2, Severity 3. When the safety lead opens the Risk Matrix filtered to Active only and selects that cell, this assessment is listed there for review.
Expected result
After scoring, each control measure carries a clear before-and-after rating, the assessment shows a single headline risk level driven by its worst residual risk, and the assessment appears in the matching cell on the Risk Matrix. Anyone with view access can then see, at a glance, how much risk remains across the plant and which assessments sit in the higher-risk cells.
Availability and limitations
This capability is generally available.
- Fixed 5x5 scales. The likelihood and severity scales and the risk-level thresholds are built in and are the same for every assessment; they are not configurable per plant.
- Whole numbers only. Likelihood and severity must each be a whole number from 1 to 5. There are no half-steps, so the smallest possible score is 1 and the largest is 25.
- The headline score follows residual risk. An assessment's position on the Risk Matrix and its Risk Summary come from the single worst residual-risk measure, not from initial risk and not from an average. Lowering one measure's residual risk only changes the headline if that measure was the worst one.
- Scoring is locked after approval. You can only add or change scores while the assessment is a Draft or Refused. Approved, active, or archived assessments keep their scores until you open a new revision.
- The matrix counts assessments, not measures. A cell's number is how many assessments land there, not how many individual hazards. One assessment counts once, at its worst residual cell.
Troubleshooting
- There is no Add Measure button. The assessment is not editable, or you lack the Create assessment permission. Confirm the assessment status is Draft (or Refused) and that you are the latest revision; approved and active assessments are read-only until you start a new revision.
- An assessment is missing from the Risk Matrix. Check the status filter. It defaults to Active only, so Draft, Pending Approval, or Archived assessments are hidden until you switch the filter to include their status.
- The headline score did not change after I lowered a residual risk. The headline uses the worst residual risk in the assessment. If the measure you edited was not the worst one, the headline stays put; lower the residual risk on the highest-scoring measure to move it.
- You cannot move past the Assess Risk step. Both the initial and residual risk scores are required. Make sure both dropdowns have a value on each score before selecting Next.
Related guidance
- Create a risk assessment — start the assessment your scored control measures belong to.
- Use AI assistance in a risk assessment — draft hazards and suggested scores with the assistant.
- Submit and approve a risk assessment — lock in scores by moving the assessment through approval.
- Review a risk assessment — re-check scores on a schedule.
- Safety overview — the rest of the safety module.
Create a risk assessment
Start a new draft risk assessment in Bulk to document a task, its hazards, and the control measures that keep people safe.
Use AI assistance in a risk assessment
Upload a PDF or photo to an editable draft risk assessment and let the Assistant propose a task description and control measures that you review and apply.