Review activity logs
Find, filter, and inspect the organization-wide audit trail of who changed what and when across your Bulk tenant, for compliance reviews and investigations.
Activity Logs is the searchable audit trail for your whole Bulk organization. Every meaningful change — a routing edited, a quality audit overridden, a user's role updated, a sign-in — is recorded as a log entry that captures who did it, what changed, and exactly when. You open the page to answer questions like "who changed this?", "when did this setting flip?", or "show me everything this person did last week."
An audit trail is a chronological record of actions kept for accountability. Bulk keeps this record so you can investigate unexpected changes, reconstruct the history of a record, and provide evidence during a compliance review. The page itself is labelled for SOC 2 — a common security and compliance standard whose reviewers routinely ask organizations to demonstrate a record of who changed what and when.
The log is read-only. Nothing you do on this page alters production data; you are only viewing history that Bulk already captured.
Who can view activity logs
Viewing activity logs requires the audit_logs.view permission. In the default role set, three roles carry it:
- Super user — full platform access.
- Entity admin — administrative access across the organization.
- Manager — full operational management access.
If you sign in with a role that does not include this permission, the page is not reachable from your navigation. Roles and permissions are managed separately; see the related guidance below to review or adjust who holds audit_logs.view.
Open the page
You reach activity logs from the organization settings area:
- Open Settings.
- Under Organization, select Activity Logs.
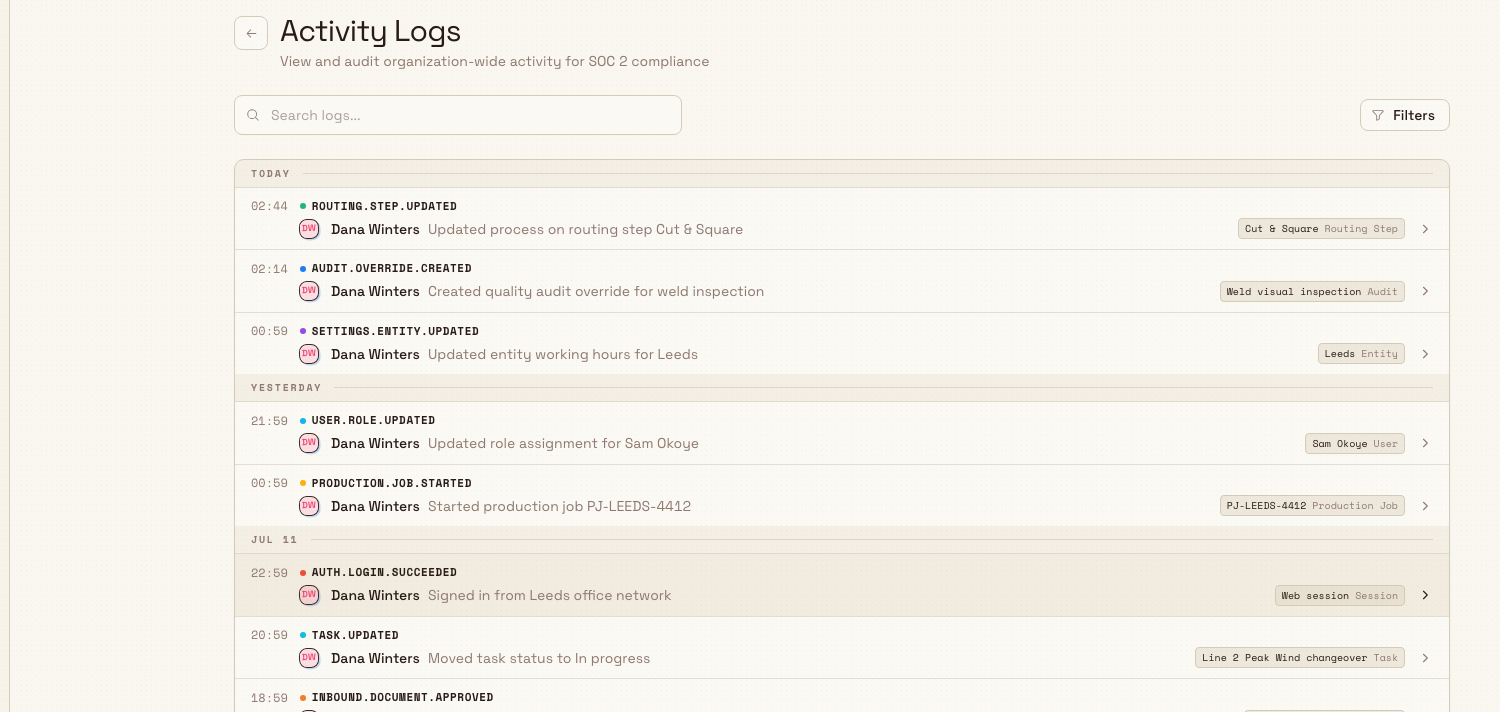
The page opens at the path /settings/organization/logs. You can also jump straight there from the global command search by looking for "Audit log". The header reads Activity Logs, with the summary "View and audit organization-wide activity for SOC 2 compliance".
administration.organization.activity-logs-01
What each entry shows
Entries are grouped under day dividers — TODAY, YESTERDAY, or a date such as MAR 4 — with the newest activity first. Each row is laid out on two lines:
- Time and event. The time of day (for example
14:32), a coloured dot for the event category, and the event code in uppercase — for exampleROUTING.STEP.UPDATEDorAUDIT.OVERRIDE.CREATED. Hovering the time shows the full date and timestamp. - Who and what. The person who performed the action (their avatar and name), a short description of what happened, and — where relevant — a subject chip naming the specific record and its type, such as a production job or a routing.
Actions performed automatically by Bulk rather than a person are attributed to System.
Expand a row for the detail
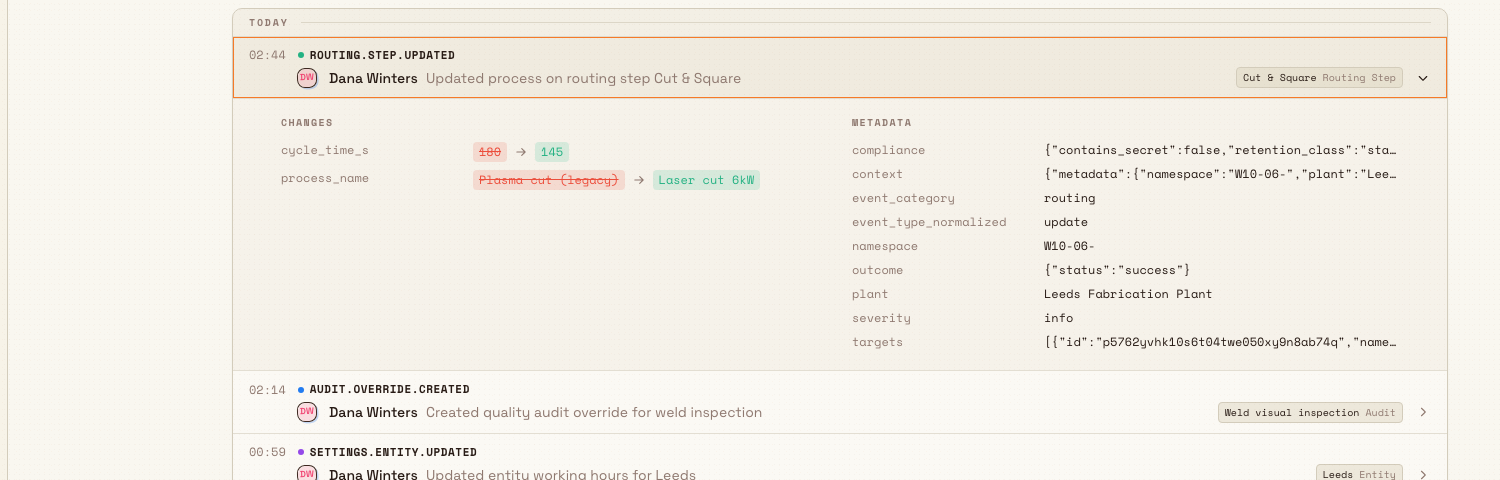
Rows that carry field-level detail are clickable (they show a caret on the right). Select the row, or press Enter or Space when it is focused, to expand an inspector panel with up to two sections:
- Changes. The fields that were set or modified. When a value changed, the previous value is shown struck through next to the new value, so you can read the before-and-after at a glance. Newly set values appear on their own, and removed values appear struck through.
- Metadata. Additional context Bulk recorded with the event, shown as a list of properties.
Rows without recorded changes or metadata are not expandable.
Inbound document reuse is recorded here as well. Saving a full template, applying one to a draft, and cloning a document create traceable entries with the acting user and the affected document or template. Filter to Inbound, then search by the document number or template name when you need to reconstruct how a repeated job was prepared.
administration.organization.activity-logs-03
Search and filter
Two tools narrow the list: a search box on the toolbar and a set of facet filters in a drawer.
Full-text search
Type in the Search logs... box to match across the event, the description, the user's name and email, the subject name, and recorded properties. Search is debounced, so results refresh a moment after you stop typing.
Filters drawer
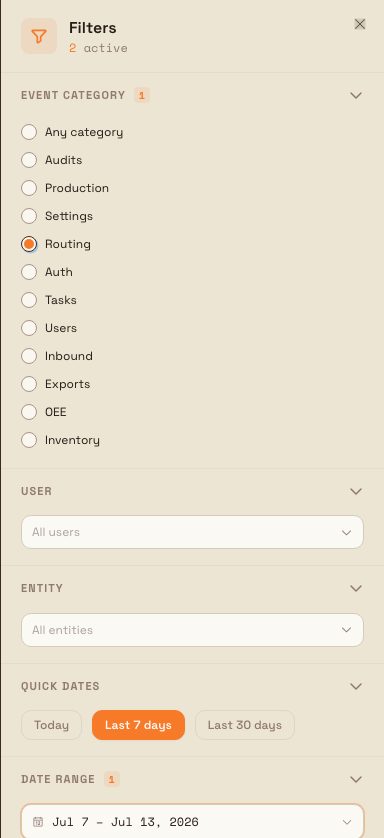
Select Filters to open the drawer titled "Filters" ("Narrow down activity logs by event category, user, entity, and date"). It offers:
- Event Category. Choose one category to focus on, or leave it on Any category. The categories are Audits, Production, Settings, Routing, Auth, Tasks, Users, Inbound, Exports, OEE, and Inventory.
- User. Pick a person to see only their activity. Start typing to search the list.
- Entity. If your organization runs more than one site, an Entity filter appears so you can narrow to a single site; with a single site there is nothing to narrow, so the filter is hidden.
- Quick Dates. One-click ranges: Today, Last 7 days, or Last 30 days. Selecting the active preset again clears it.
- Date Range. A custom picker for any start and end date when the quick ranges are not specific enough.
Active filters appear as chips below the toolbar — Search, Category, User, Entity, and Date Range — each with its own clear control. Clear all removes every filter and the search term at once. The result count beside the filters reflects what the current filters return.
Your search term, filters, and page are stored in the page address, so a filtered view is shareable and bookmarkable: copy the browser URL and send it to a colleague to show them the exact same slice of the log.
administration.organization.activity-logs-02
Example: investigating a routing change at Granite Peak
A production manager at Granite Peak Manufacturing notices that jobs at the Leeds Fabrication Plant are running a different sequence than expected, and wants to confirm who changed the routing and when.
- They open Settings > Organization > Activity Logs.
- In Filters, they set Event Category to Routing and, because Leeds is one of several sites, set the Entity filter to Leeds Fabrication Plant.
- They choose the Last 7 days quick date to bound the search to the period the change could have happened.
- The list narrows to routing activity at Leeds. They spot a
ROUTING.STEP.UPDATEDentry from two days ago, attributed to a named user. - They expand the row. The Changes section shows the step's previous process struck through beside the new one, confirming exactly what was altered.
- They copy the page URL into the incident note so a colleague can open the identical filtered view.
The whole review takes seconds, and no production data is touched — the manager only reads the history Bulk already recorded.
Reading larger result sets
Results are paginated at 50 entries per page. The footer shows the range you are viewing and the total — for example 1 – 50 / 1,240 — with a page indicator and Previous page / Next page controls. Changing a search term or filter returns you to the first page.
Bulk counts and displays each activity event once, even if delivery retries stored more than one copy behind the scenes. This keeps the total in the footer aligned with the unique entries you can page through, including in large audit histories.
Recently created entries may lag
Search is powered by an index that updates continuously. Just after an action happens, you may briefly see the note "New records are still syncing. Latest results may not appear yet." The entry will appear once indexing catches up — refreshing the page a moment later, or clearing the search term, usually shows it.
Limitations and feature state
Activity Logs is generally available. Keep these boundaries in mind:
- View and filter only. This screen has no built-in button to export or download the log to a file. You can share a filtered view by URL, but bulk extraction of log records is not offered here.
- Organization-wide, tenant-scoped. The page shows activity across every site in your organization, and the Entity filter narrows it to one site. It does not span other organizations.
- History vs. live search. When you browse without a search term, Bulk serves the stored history newest-first. Typing a search term switches to the full-text index. In practice the results are consistent; the brief syncing note above is the main visible difference.
- What is captured. Entries are generated by Bulk as actions occur across modules (audits, production, settings, routing, auth, tasks, users, inbound, exports, OEE, and inventory). You cannot add, edit, or delete entries yourself.
Troubleshooting
- "No activity logs found." The current filters or search term match nothing. The empty state suggests you "Try adjusting your filters or check back later." Widen the date range, clear the category or user filter, or select Clear all to start over.
- The list is unexpectedly empty. If the activity-history service is temporarily unavailable, Bulk keeps the page open with an empty list instead of showing a server error. Your recorded history is not deleted; refresh the page after the service recovers.
- The page is not in your Settings menu. Your role does not include
audit_logs.view. Ask an administrator to review your role, or use one of the roles that carries the permission (Super user, Entity admin, or Manager). - A recent action is missing. See the syncing note above — the newest entries can take a moment to index. Refresh shortly, or clear the search term to fall back to the stored history.
Related guidance
- Manage roles and permissions — review or grant the
audit_logs.viewpermission. - Manage users — the people who appear in the User filter and as actors on each entry.
- Organization settings — the rest of the organization-level administration area.