Turn operations into management visibility
How the jobs, downtime, output, and quality recorded on the floor become live dashboards, analytics, KPIs, and a cross-plant Atlas view for managers.
Last updated
Your team already records what happens on the floor: jobs booked, machines running or stopped, parts produced, quality issues raised. This workflow is about the other half of that work: turning those records into a picture a supervisor, plant manager, or company leader can read at a glance and act on. In Bulk you do not copy figures into a separate reporting tool. The same records your operators create are presented back to you as live dashboards, trend reports, key measures, and a company-wide executive view.
Bulk is a Manufacturing Execution System (MES): the software your team uses to run day-to-day work on the shop floor and in the offices around it. Because production, quality, people, and finance all live in one system, every insight in this guide reads from the same underlying data. Nobody re-keys numbers between systems, so what a manager reviews is what the floor actually recorded.
This is a workflow guide. It walks the path from recorded work to management visibility and links to the focused reference guides for each surface; it does not repeat their step-by-step instructions.
Who this is for
- Supervisors and shift leads who watch one plant during a run and need to catch a problem while it is still fixable.
- Plant managers who review a site's performance over a shift, day, or week and set targets against it.
- Company leaders who run several sites and need one place to see them side by side.
- Anyone given read-only visibility: Bulk includes a dedicated Dashboards role for people who should see the numbers without changing anything.
Before you begin
Two things decide what you can open, and an administrator sets both:
- Installed apps and access. App installation and your permissions are separate. The plant Dashboard, Analytics and Atlas have their own entry and permission checks, so it is normal to have access to some and not others.
- Your role and permissions. Viewing a dashboard, editing a shared Atlas view, and defining a key measure are separate permissions. The built-in roles line up roughly like this:
- Super user and Entity admin: full access, including setup and shared-view management.
- Manager: can view Atlas, boards, and the operating-effectiveness analytics for their plant.
- Dashboards: a read-only role that can open dashboards, boards, KPIs, Atlas, and the Digital Twin, but change nothing.
If an area you expect is missing, ask your administrator to check its installation and your access. See Understand access and visible navigation. Open installed app cards from Home or use the navigation sidebar within an app.
A read-only way to share the numbers
If someone needs to see performance but should not change targets, boards, or views, the built-in Dashboards role is the safe choice. It opens the dashboards, KPIs, Atlas, and boards described here in read-only form, so you can put the numbers in front of a wider audience without handing out editing rights.
How operations become visibility
The path runs from a single machine in the moment up to the whole company over time. You will not use every stage every day: pick the one that answers the question in front of you.
1. The work records itself
The operational reports read data your team has already entered: jobs booked against workstations, machine sessions and downtime events, parts output, and quality issues. Their freshness and period rules differ; check those labels before treating a figure as final. Dashboard picker previews are illustrative examples, while the dashboard pages compute their own data. If a number looks wrong, first check the underlying booking and the selected period.
2. Watch one plant, right now
Two surfaces cover a single site as it runs:
- The Dashboard entry in the PLATFORM group of the sidebar is a board you build for yourself. You add panels (called widgets) from a marketplace and arrange them across one or more pages: output, downtime, quality, and more: so your most-watched numbers sit together. See Open a dashboard.
- The Dashboards area is a picker of nine ready-made, full-screen dashboards: OEE for People, OEE for Assets, Utilization Grid, Assets Board, Assets Sheet, Value Flow, Pareto for Downtime, OEE events, and KPI Table. OEE (Overall Equipment Effectiveness) combines availability, performance and quality into one measure. The card previews are illustrative examples. Select a card, then open it to review the actual dashboard. The current Custom boards section shows zero dashboards and a development placeholder.
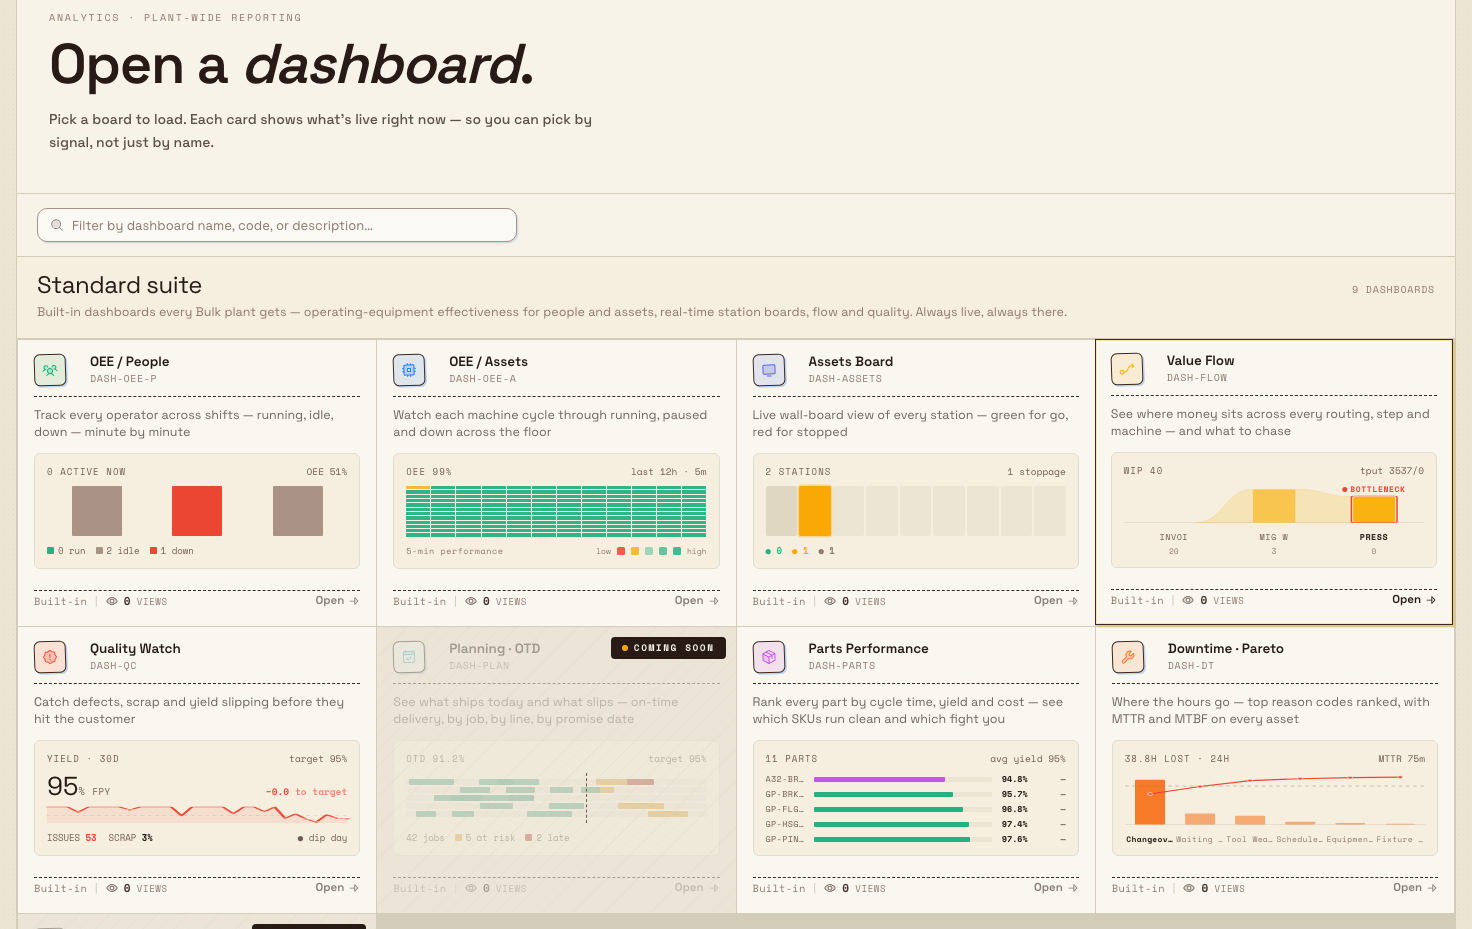
For what each dashboard shows, see Dashboards.
3. Look for trends and causes
When you need to understand why rather than what, open the Analytics module in the sidebar. Its reports are:
- 5S Dashboard: workplace-organization scoring (Beta).
- Asset Revenue: how much each machine earned over a run (Beta).
- OEE Timeline: a time-based view of where equipment (the Assets view) or operators (the Users view) lost time.
- Asset Board: a live board of station status. The cards do not show Worked, Rate, or Output. See Use the asset board.
- Assets Sheet: one table of every station, with status, downtime, and rates. See Review the Assets Sheet.
Beta means a surface works and is safe to use but its screens may still change, so treat it as a preview. See Analytics, and for the two most common investigations, Review OEE timelines and Review asset revenue.
4. Track your own measures
Built-in reports answer common questions; key performance indicators (KPIs) let you track the measures your plant cares about: for example on-time delivery or scrap rate. A KPI is a single number you define, give a target, and review over time. You set them up under Settings › KPI (which holds Categories, Management, and Targets), and capture a plant's numbers for a given day with New report under Teamboards. A Teamboard is a plant board that lays those KPIs out by category for a daily review. See KPIs, Set KPI targets, and Teamboards.
5. Compare across the whole company
Atlas is the executive view. It compares sites and their totals using metrics such as OEE, Completed jobs value, Incidents raised, Training compliance and Quality issues open. You can save named views, set monthly targets and open a drill-down panel. Read the freshness line and period legend: the pictured view has populated Live preview values while its snapshot is preparing. Closed periods use complete site-local days and exclude today. Shared or locked views can provide consistent read-only access.
Atlas is in Beta, and opening it needs the Atlas permission.
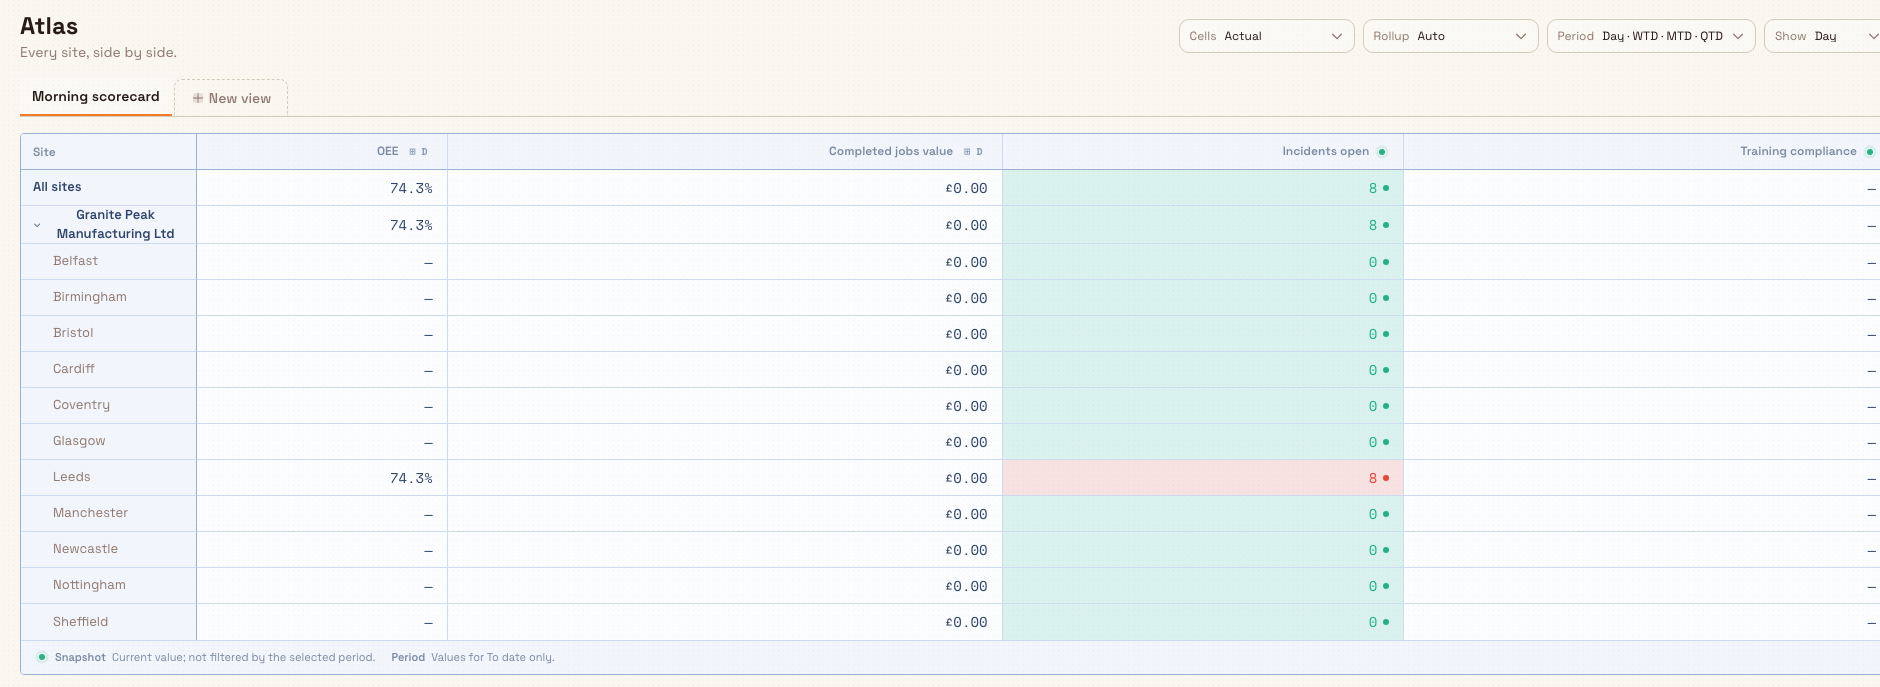
See Atlas and Review cross-plant performance in Atlas.
6. Put the picture where people work
Visibility is most useful where the work happens. Two features carry it there:
- Boards: use the Boards app for the available board tools. The current Dashboards picker shows a separate development placeholder for custom dashboards; its previews do not demonstrate saved custom-board integration. See Boards.
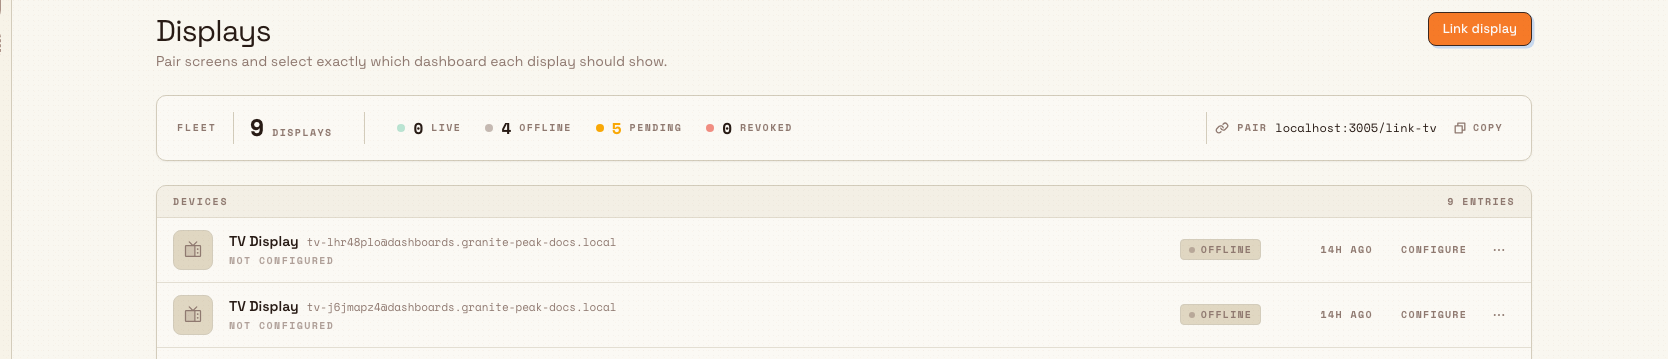
- Displays: under Settings › Organization › Displays (in Beta), inspect the fleet and use Link display to open the pairing dialog. Open the setup link on the physical screen, then enter its six-character Pairing code in that dialog. An authorized administrator configures the linked device's target. The pictured fleet contains offline time clocks; it does not demonstrate a live dashboard on a TV.
A day at Wayne Corp
Wayne Corp runs several sites, including Gotham Applied Sciences. Here is a fictional example of the workflow:
- Spot it. Bruce opens OEE for Assets and notices one machining bench performing below the others.
- Explain it. He reviews OEE Timeline › Assets and Pareto for Downtime for the relevant period. A Pareto view ranks causes largest-first.
- Act on it. The supervisor raises a maintenance task and tracks changeover time with a KPI and target on the plant's Teamboard.
- Compare it. Bruce opens a saved Atlas view to compare Gotham with the other Wayne plants, checking the freshness and period labels before drawing a conclusion.
- Keep it visible. An authorized administrator configures an appropriate linked display for the review board. The offline time-clock fleet in this guide is orientation, rather than evidence that this final step was performed.
The operational figures use the same recorded jobs and downtime events. The example describes how to use those records; it does not claim that the illustrated actions were performed during capture.
What you get
- One data thread. Operational figures use the records the floor created. Check the surface's freshness and period rules when reviewing them.
- From summary to cause. You can move from a plant total, to a machine's timeline, to the specific downtime reason behind it.
- From one plant to many. The same metrics roll up from a single site to a company-wide comparison in Atlas.
- Visible where it matters. Any dashboard can live on a screen on the floor.
Feature state
The core of this workflow is generally available: the plant Dashboard, the Standard suite of dashboards, KPIs, Teamboards, and Boards are standard, supported parts of Bulk.
Some surfaces are still maturing and carry a Beta label:
- Atlas is in Beta.
- In Analytics, the 5S Dashboard and Asset Revenue reports are in Beta. OEE Timeline, Asset Board, and Assets Sheet are not.
- Displays is in Beta.
Beta surfaces work and are safe to use, but their screens and behavior may still change, so treat them as previews rather than finished features.
If something looks off
- A dashboard is empty or a number looks wrong. Insights only show what has been recorded. Check that the underlying jobs, machine sessions, or quality entries exist for the period you are viewing before treating a figure as final.
- An app is missing or unavailable. Ask your administrator to check installation, permissions and plant access. See Understand access and visible navigation.
- An Atlas view opens without editing controls. You are viewing a shared or locked view. Editing a view or setting targets needs the Atlas manage permission: ask whoever owns the view, or an administrator, for access.
- A display shows the wrong board or has stopped. Re-pair it from Settings › Displays and reselect its dashboard; a display that was unpaired must be paired again before it can be used.
Related guidance
- Insights and finance: the area overview this workflow belongs to.
- Close the commercial loop: the finance workflow that turns the same completed work into invoices.
- Insights and visual management: the full reference for every surface named here.
- Dashboards, Analytics, KPIs, Teamboards, Boards, and Atlas: the individual references.
- Review the Utilization Grid, Review OEE events, and Review the Assets Sheet: hourly utilization, downtime event counts, and the station table.
- Open a dashboard: the quickest way in.
- Administrator setup: Configure OEE dashboards, Configure KPI categories, and Configure reports.
- Workflows: every end-to-end guide across Bulk.
Insights and finance
How Bulk turns shop-floor activity into numbers you can act on and completed work into invoices, with links to the analytics, Atlas, and Finance guides.
Close the commercial loop
Turn finished production work into approved, issued, and confirmed invoices in Bulk, and handle voids and credit notes so nothing you make goes unbilled.